You may be wondering how to set up colors when using Matplotlib to create graphs and diagrams.
This article will explain in detail how to set up Matplotlib’s color-related settings.
After reading it, you will be able to freely set the colors of your graphs using Matplotlib to enhance their visual appeal and information conveyance.
Topics covered include RGB array specification, hexadecimal, single character specification, grayscale, Tableau colors, CSS colors, and more!
Color Options
Color can be set by RGB, single character, Tableau Colors, or CSS Colors.
- RGB or RGBA
-
- Tuple of float values : Closed interval [0, 1], (red, green, blue, alpha)
(0.1, 0.2, 0.5, 0.3) - Case-insensitive hex :
'#0f0f0f',#0f0f0f80' - Hex shorthand of duplicated characters. :
#abc'(#aabbcc')
- Tuple of float values : Closed interval [0, 1], (red, green, blue, alpha)
- Single character
-
- Grayscale : closed interval [0, 1].
'0'=black,'1'=white - Single character shorthand notation : 8 basic colors.
'b'=blue
- Grayscale : closed interval [0, 1].
- Tableau Colors
-
- Tableau Colors : ‘T10’ categorical palette.
'tab:blue' - “CN” Colors : C” + “Number” calls a color cycle. Used by default.
'C0'
- Tableau Colors : ‘T10’ categorical palette.
- CSS or xkcd Colors
-
- X11/CSS4 : X11/CSS4 color name with no spaces.
'aqua' - xkcd : color name from xkcd color survey.
'xkcd:sky blue'
- X11/CSS4 : X11/CSS4 color name with no spaces.
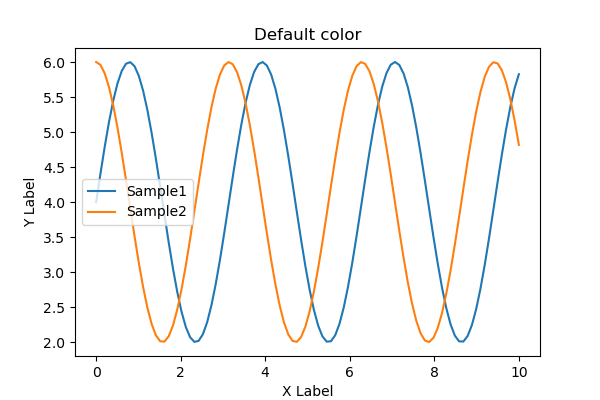
Default colors and Entire code
No colors are set and the default colors are used
The code from the next chapter changes only step3 “Plot graphs
# step0 Import libraries
import matplotlib.pyplot as plt
import numpy as np

# step1 Create data
x = np.linspace(0, 10, 100)
y1 = 4 + 2 * np.sin(2 * x)
y2 = 4 + 2 * np.cos(2 * x)

# step2 Create graph frames
fig, ax = plt.subplots(figsize=(6, 4))

# step3 Plot graphs
# Specify the color here
ax.plot(x, y1, label='Sample1'))
ax.plot(x, y2, label='Sample2')

# step4 Set a title and axis labels
ax.set_title('Default color')
ax.set_xlabel('X Label')
ax.set_ylabel('Y Label')
ax.legend()

# step5 Call the Figure
plt.show()
RGB or RGBA
There are three ways to specify colors in RGB or RGBA (A is transparency)
- Tuple of float values : Closed interval [0, 1], (red, green, blue, alpha)
(0.1, 0.2, 0.5, 0.3) - Case-insensitive hex :
'#0f0f0f',#0f0f0f80' - Hex shorthand of duplicated characters :
#abc'(#aabbcc')
Tuple of float values
In an array (tuple), enter RGB = (red, green, blue) or RGBA = (red, green, blue, alpha).
The value of each element of the array is a float value between 0 and 1.
RGB : color=(0.2, 0.7, 0.7)
RGBA : color=(0.1, 0.2, 0.5, 0.3)
# step3 Plot graphs
# tuple
ax.plot(x, y1, label='color=(0.2, 0.7, 0.7)', color=(0.2, 0.7, 0.7))
ax.plot(x, y2, label='color=(0.1, 0.2, 0.5, 0.3)', color=(0.1, 0.2, 0.5, 0.3))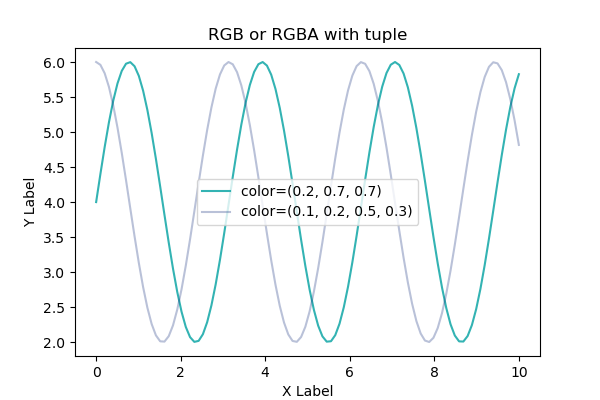
Case-insensitive hex
Specify the color in hexadecimal.
For RGBA alpha, append 00~99 at the end
RGB : color=#008BCD4
RGBA : color=#4CAF5070
# step3 Plot graphs
# hexadecimal
ax.plot(x, y1, label='#00BCD4', color='#00BCD4')
ax.plot(x, y2, label='#4CAF5070', color='#4CAF5070')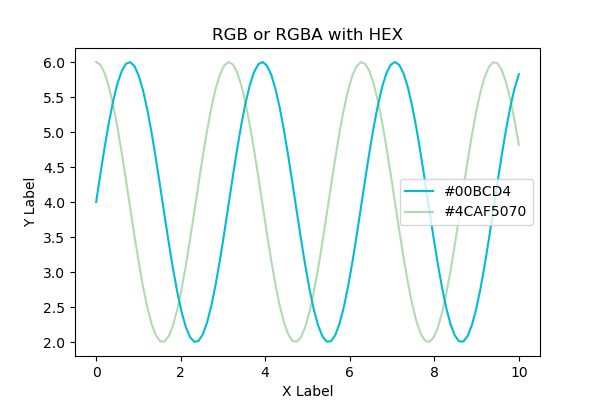
Hex shorthand of duplicated characters
Specifies the color in hexadecimal abbreviated notation.
RGB : #1BB=11BBBB
RGBA : #D2C6=#DD22CC66
# step3 Plot graphs
# Hex shorthand of duplicated characters
ax.plot(x, y1, label='#1BB', color='#1BB')
ax.plot(x, y2, label='#D2C6', color='#D2C6')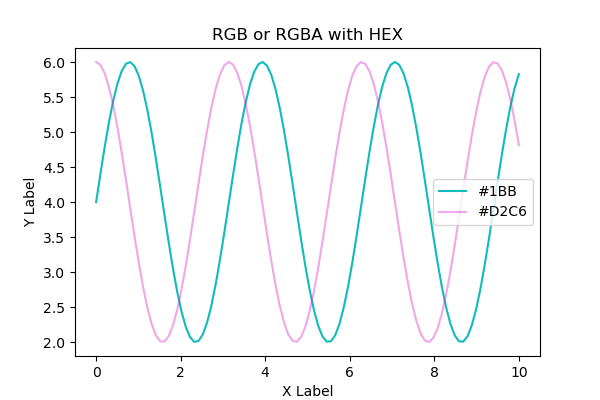
Single character
There are two ways to specify the color of a single character.
- Grayscale : closed interval [0, 1].
'0'=black,'1'=white - Single character shorthand notation : 8 basic colors.
'b'=blue
Grayscale
For grayscale, enter a float value of 0~1
Enter 0.5 for gray
black:'0'
white:'1'
# step3 Plot graphs
# Grayscale
ax.plot(x, y1, label='Black=0', color='0')
ax.plot(x, y2, label='Gray=0.6', color='0.6')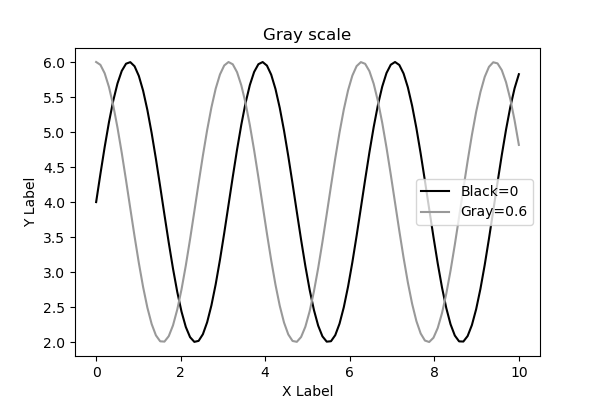
8 Basic Colors
This is a method of expressing only one basic color for single character.
The following 8 colors can be specified
- blue:
'b' - green:
'g' - red:
'r' - cyan:
'c' - magenta:
'm' - yellow:
'y' - black:
'k' - white:
'w'
# step3 Plot graphs
# Basic colors
ax.plot(x, y1, label='b', color='b')
ax.plot(x, y2, label='r', color='r')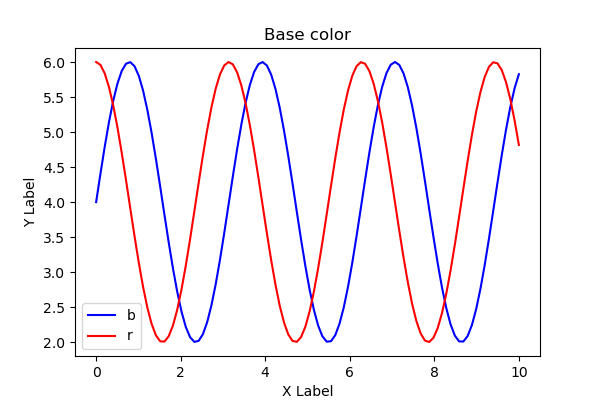
Tableau Color
You can also use Tableau 10 in the Tableau color palette
- Tableau Colors : ‘T10’ categorical palette.
'tab:blue' - “CN” Colors : C” + “Number” calls a color cycle. Used by default.
'C0'
Tableau Color Palette
Tableau 10 in the Tableau color palette is prefixed with tab
'tab:blue''tab:orange''tab:green''tab:red''tab:purple''tab:brown''tab:pink''tab:gray''tab:olive''tab:cyan'
# step3 Plot graphs
# Tableau color palette
ax.plot(x, y1, label='tab:blue', color='tab:blue')
ax.plot(x, y2, label='tab:orange', color='tab:orange')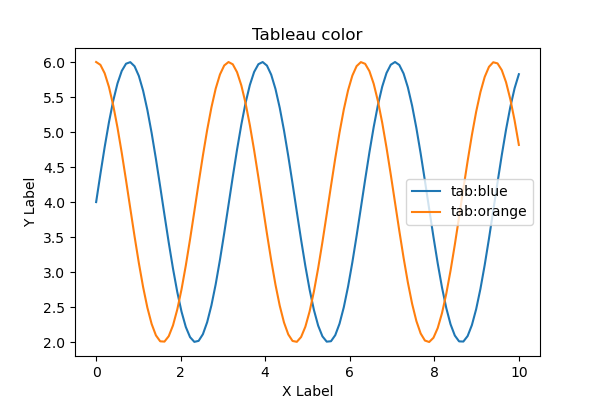
“CN” Colors
There is a method to call a color cycle with “C” + “Number
Specify by typing color='C0', color='C1'
'#1f77b4'='tab:blue''#ff7f0e'='tab:orange''#2ca02c'='tab:green''#d62728'='tab:red''#9467bd'='tab:purple''#8c564b'='tab:brown''#e377c2'='tab:pink''#7f7f7f'='tab:gray''#bcbd22'='tab:olive''#17becf'='tab:cyan'
# step3 Plot graphs
# CN colors
ax.plot(x, y1, label='C0', color='C0')
ax.plot(x, y2, label='C1', color='C1')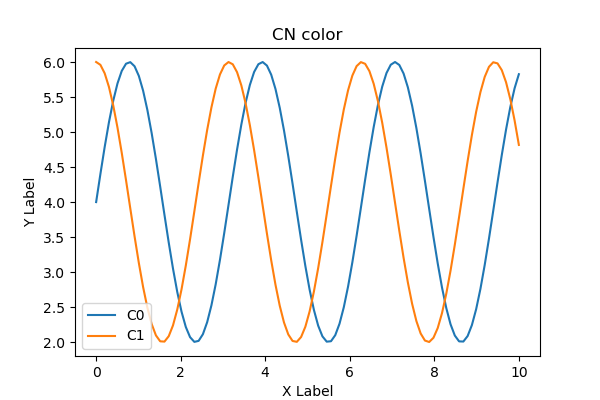
Update rcParams["axes.prop_cycle"] to change the color cycle
import matplotlib as mpl
mpl.rcParams['axes.prop_cycle'] = cycler(color=['r', 'g', 'b', 'y'])
X11, CSS, xkcd Color
Specifies the color as a string
- X11/CSS4 : X11/CSS4 color name with no spaces.
'aqua' - xkcd : color name from xkcd color survey.
'xkcd:sky blue'
X11/CSS4 color name
String representing a color in the X Window System
Enter a string without spaces, 'aquamarine'
You can specify one of the following 140 colors
# step3 Plot graphs
# CSS color name
ax.plot(x, y1, label='olive', color='olive')
ax.plot(x, y2, label='mediumseagreen', color='mediumseagreen')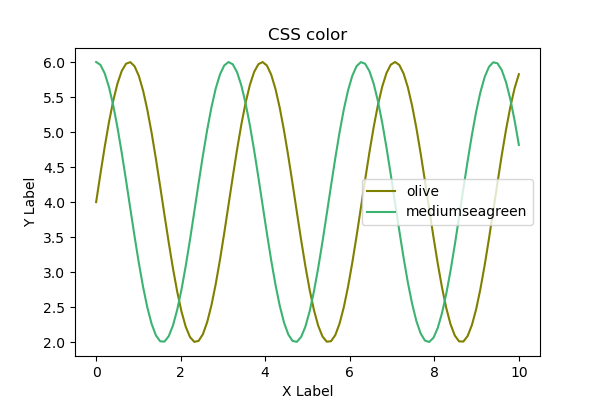
xkcd color name
954 most common RGB monitor colors as defined by hundreds of thousands of participants
prefix it with 'xkcd:sky blue' and xkcd:.
Here are the colors you can specify
# step3 Plot graphs
# xkcd color name
ax.plot(x, y1, label='xkcd:pink', color='xkcd:pink')
ax.plot(x, y2, label='xkcd:teal', color='xkcd:teal')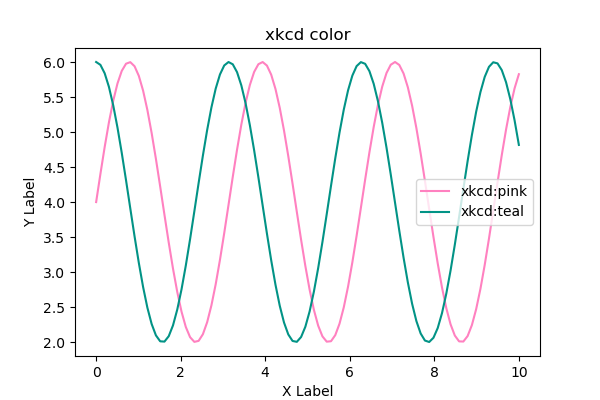
References
List of colors that can be specified in Matplotlib
Specify color
CSS4 color name
Comments