Are you confused when adding a legend to a graph in Matplotlib because you don’t know where it can be placed or how to set the color and label of the legend?
This article covers most of the settings related to Matplotlib legends, detailing how to specify the position, change the color, and add labels.
After completing the reading, you will learn the art of using Matplotlib to freely place legends on graphs and customize colors and labels. This can improve the readability of graphs and their ability to convey information.
Legend Options
The legend of the graph is displayed with the Axes.legend function or pyplot.legend function.
In this article, we explain the style using the Axes.legend function.
- Parameters
-
- handles (list of str) : A list of Artists (lines, patches) to be added to the legend.
- labels (list of str) : A list of labels to show next to the artists.
- loc (str) : The location of the legend.
best,center,upper,lower,left,rightand their combinations. - bbox_to_anchor (BboxBase) : Box that is used to position the legend in conjunction with loc.
- prop (dict) : FontProperties. The font properties of the legend.
- fontsize (int or str) : The font size of the legend.
- labelcolor (color) : The color of the text in the legend.
- edgecolor (color) : The legend’s background patch edge color.
- facecolor (color) : The legend’s background color.
- frameon (True or False) : Whether the legend should be drawn on a patch (frame).
- framealpha (float) : The alpha transparency of the legend’s background.
- fancybox (True or False) : Rounded edges of the legend frame
- shadow (True or False) : Whether to draw a shadow behind the legend.
- Returns
- Official Documentation
Default legend (Axes.legend)
When setting the legend, the default legend is displayed without specifying anything
Add legends to graphs
The Axes.legend function can be used to customize a graph (Axes object) with a legendax.legend()
The following tabs explain how to use Axes.legend with code and flowcharts
# step0 Import libraries
import matplotlib.pyplot as plt
import numpy as np

# step1 Create data
x = np.linspace(0, 10, 100)
y1 = 4 + 2 * np.sin(2 * x)
y2 = 4 + 2 * np.cos(2 * x)

# step2 Create graph frames
fig, ax = plt.subplots(figsize=(6, 4))

# step3 Plot graphs
ax.plot(x, y1, label='Sample 1')
ax.plot(x, y2, label='Sample 2')

# step4 Set a legend
ax.legend()

# step5 Set a title and axis labels
ax.set_title('Default Legend')
ax.set_xlabel('X Label')
ax.set_ylabel('Y Label')

# step6 Call the Figure
plt.show()

Single legend for multiple graphs
When drawing multiple graphs (= placing multiple Axes objects in a Figure), you can combine them into one by adding a legend to the Figure.plt.legend()
The following tabs explain how to use Axes.legend with code and flowcharts.
# step1 Create data
x = np.linspace(0, 10, 100)
y1 = 4 + 2 * np.sin(2 * x)
y2 = 4 + 2 * np.cos(2 * x)

# step2 Create graph frames
fig, axs = plt.subplots(2, 2, figsize=(8, 4))

# step3 Plot graphs
axs[0, 0].plot(x, y1, label='Axes 1', color='C0')
axs[0, 1].plot(x, y2, label='Axes 2', color='C1')
axs[1, 0].plot(x, y2, label='Axes 3', color='C2')
axs[1, 1].plot(x, y2, label='Axes 4', color='C3')

# step4 Set a legend
fig.legend()

# step5 Set a title and axis labels
fig.suptitle('Default Legend with pyplot.legend')
fig.supxlabel('X Label')
fig.supylabel('Y Label')

# step6 Call the Figure
plt.show()
Specify legend labels and graphs (labels, handles)
Decide (1) which name to display in the legend and (2) which graph to display
labels: Specify labelshandles: Specify graphs (Axes object)
Specify labels (labels)
labels specifies labels as an array and text to be displayed in the legend.ax.legend(labels=['Sample 4', 'Sample 5'])
Sample1 -> Sample4, Sample2 -> Sample5 and so on
# step3 Plot graphs
ax.plot(x, y1, label='Sample 1')
ax.plot(x, y2, label='Sample 2')

# step4 Set a legend
# Reconfigure labels
ax.legend(labels=['Sample 4', 'Sample 5'])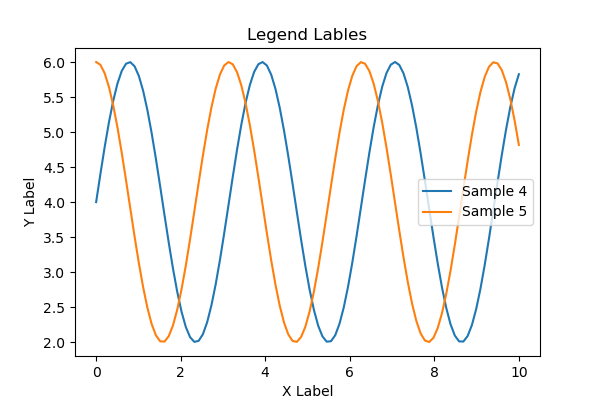
Specify graphs
handles specifies an array of Axes objects and displays only specific graphs in the legend.ax.legend(handles=[line1])
# step3 Plot graphs
line1, = ax.plot(x, y1, label='Axes 1')
line2, = ax.plot(x, y2, label='Axes 2')

# step4 Set a legend
ax.legend(handles=[line1])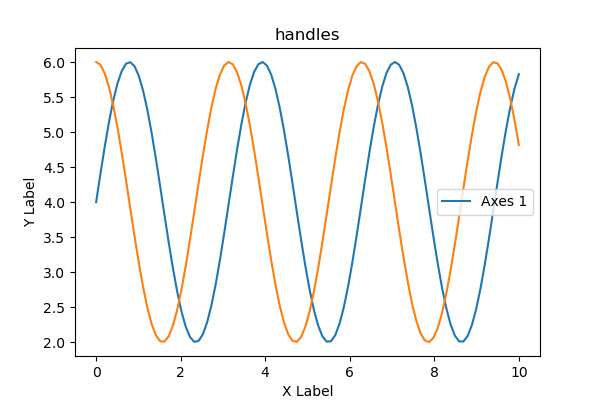
Location of the legend (loc, bbox_to_anchor)
There are two types of legend positioning, loc and bbox_to_anchor, which can be used in combination
loc:best,center,upper,lower,left,rightand their combinations.bbox_to_anchor: (x, y) to specify coordinates
Placed in the graph (loc)
The legend can be placed anywhere in the graph with loc='best'.
You can choose from best, center, upper, lower, left, right and combinations thereof.
# step4 Set a legend in the graph
ax.legend(loc='center')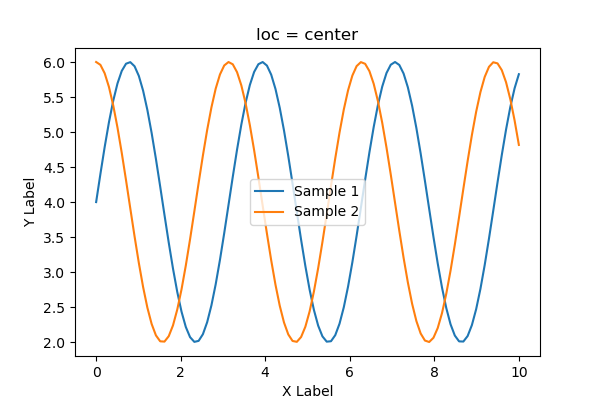
# step4 Set a legend in the graph
ax.legend(loc='lower right')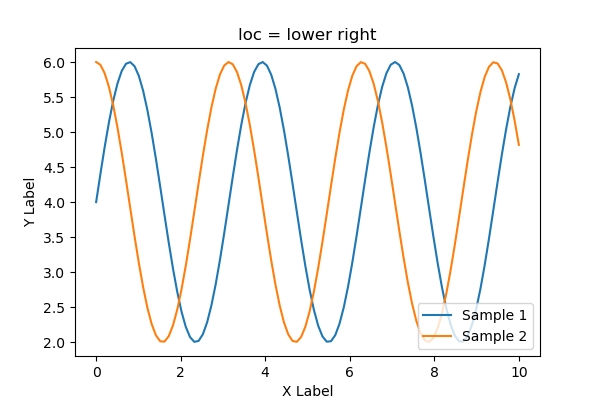
# step4 Set a legend in the graph
ax.legend(loc='upper left')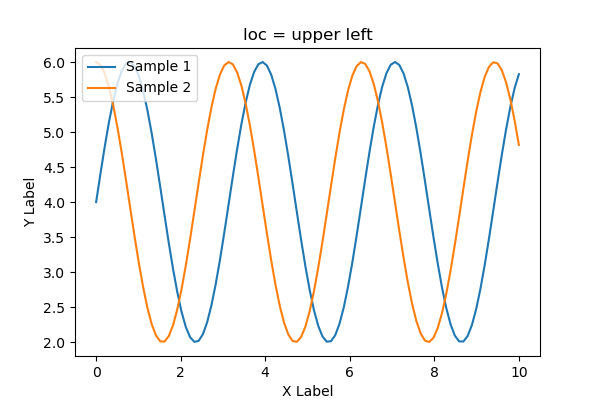
Placed outside the graph (bbox_to_anchor)
The coordinates are specified as bbox_to_anchor=(x, y).
Three patterns were drawn: (0, 0), (0.5, 0.8), (1, 1.1)
If the legend does not fit within the graph, use plt.tight_layout() to adjust it.
# step4 Set a legend outside of the graph
ax.legend(bbox_to_anchor=(0, 0))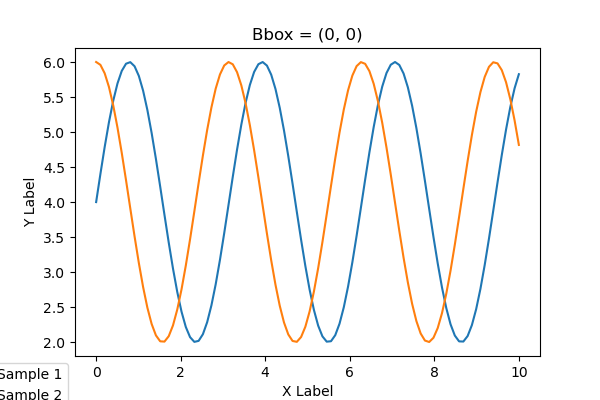
The coordinate 0.5 is the center of the graph
# step4 Set a legend outside of the graph
ax.legend(bbox_to_anchor=(0.5, 0.8))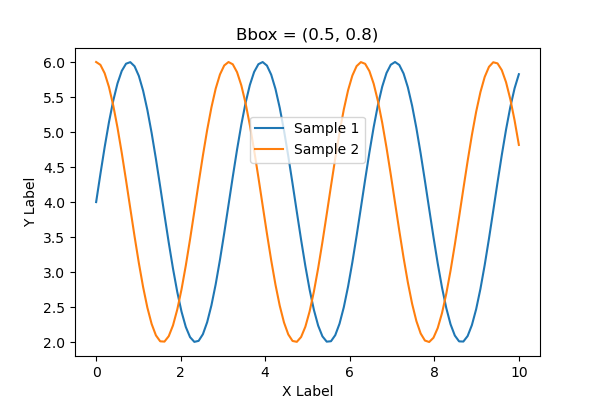
Coordinates can be more than 1.
# step4 Set a legend outside of the graph
ax.legend(bbox_to_anchor=(1, 1.1))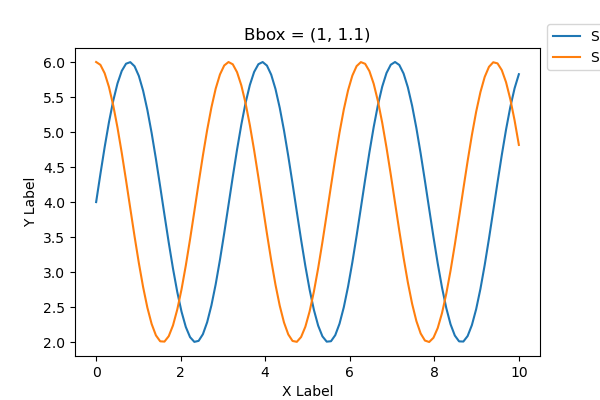
If the legend does not fit within the graph, use plt.tight_layout() to adjust it.
# step6 Call the Figure
plt.tight_layout()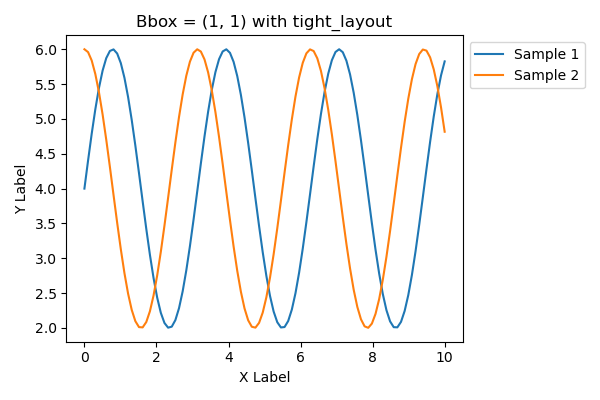
Font and Color (prop, fontsize, labelcolor, edgecolor, facecolor)
This chapter sets the font and color of the legend.
prop: FontProperties. The font properties of the legend.fontsize: The font size of the legend.labelcolor: The color of the text in the legend.edgecolor: The legend’s background patch edge color.facecolor: The legend’s background color.
Please refer to the following for how to specify colors in Python
Font Properties (prop)
propcustomizes font type, style, size, thickness, etc. in dictionary format.
'weight' : 'bold'= Font weight: bold'style' : 'italic'= Font style: Italic'family' : 'Times New Roman'= Font type:Times New Roman
# step4 Set a legend with font properties
ax.legend(prop={'weight': 'bold', 'style': 'italic', 'family': 'Times New Roman'})
Font Size (fontsize)
fontsize changes the font size
However, if the size is specified in prop, it will be invalid.
Use'xx-small', 'x-small', 'small', 'medium', 'large', 'x-large', 'xx-largeto specify font size as a string.
# step4 Set a legend with the font size
ax.legend(fontsize='large')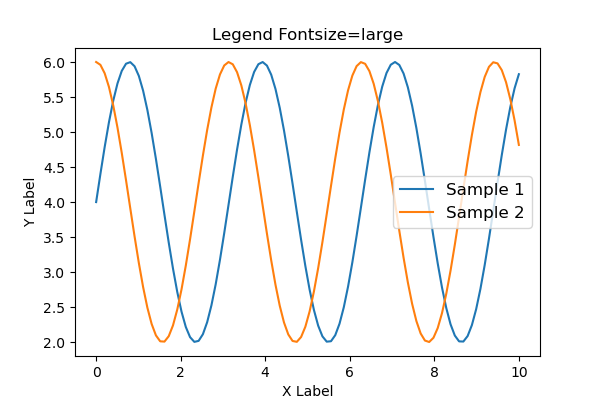
Font size can also be specified float
# step4 Set a legend
ax.legend(fontsize=20)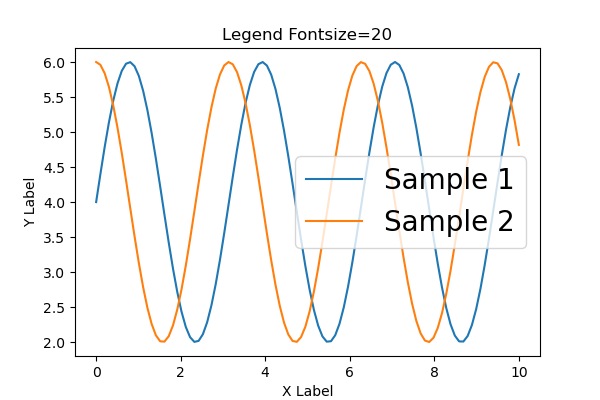
Label Color (labelcolor)
labelcolor changes the label color
Specify the color directly with 'red'.
# step4 Set a legend
ax.legend(labelcolor='red')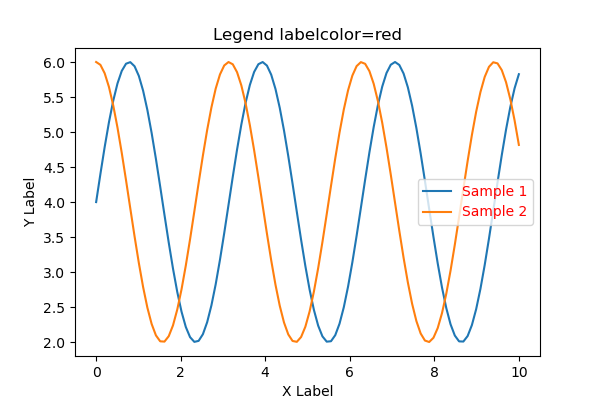
Patch Edge Color (edgecolor)
edgecolor changes the legend’s background patch edge color.
Specifies color by RGB string
# step4 Set a legend
ax.legend(edgecolor='#00BCD4')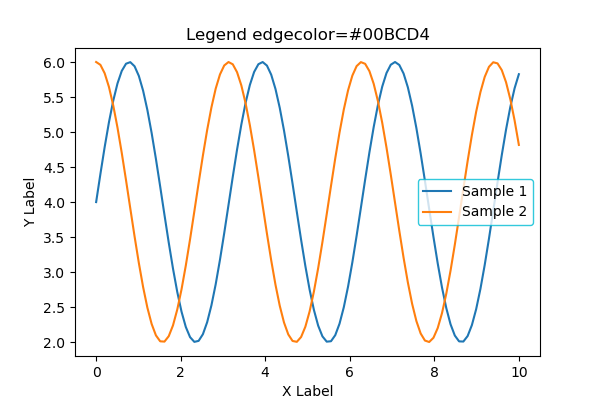
Background Color (facecolor)
facecolor changes the legend’s background color.
Entering a string between 0~1 will result in grayscale.
'0': black'1': white
# step4 Set a legend
ax.legend(facecolor='0.8')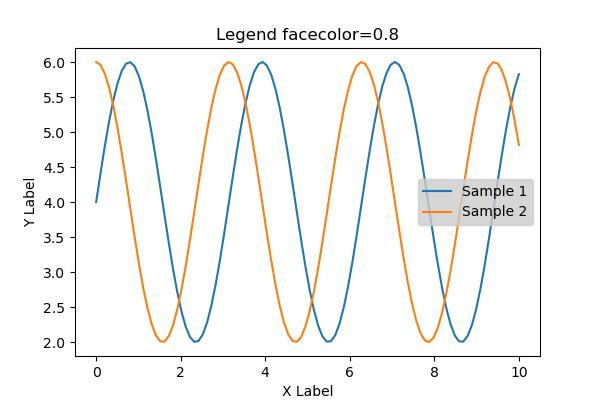
Title (title, title_properties, title_fontsize)
title adds the title of the legend
The custom font for the title is explained in detail in the next section.
# step4 Set a legend
ax.legend(title='Legend Title')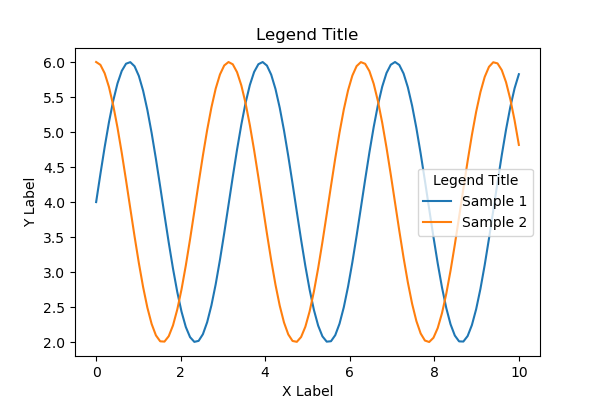
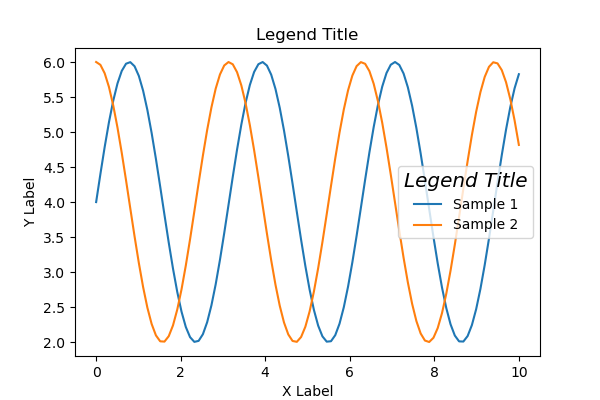
Custom font for titles (title_properties)
title_properties customizes font type, style, size, thickness, etc. in dictionary format.
'weight' : '500'= Font weight'style' : 'oblique'= Font style: slanted'size' : 'x-large'= Font size
Use'xx-small', 'x-small', 'small', 'medium', 'large', 'x-large', 'xx-largeto specify font size as a string.
# step4 Set a legend
ax.legend(
    title='Legend Title',
    title_fontproperties={'weight': '500', 'style': 'oblique', 'size': 'x-large'}
)
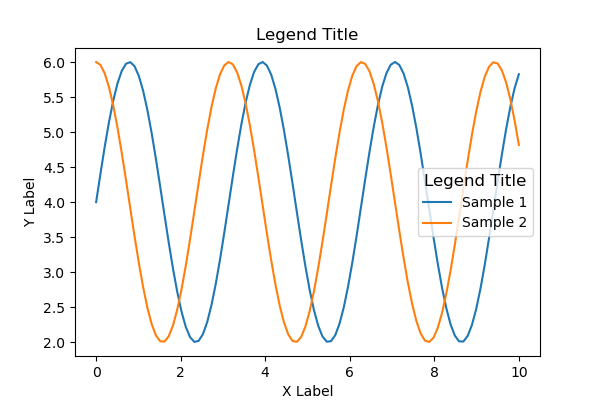
Font size of the title (title_fontsize)
title_fontsize changes the font size
However, it is disabled if the size is specified in title_properties
Font size is specified float
# step4 Set a legend
ax.legend(
    title='Legend Title',
    title_fontsize='12'
)
Frame (frameon, framealpha, fancybox, shadow)
Set the settings related to the legend frame.
frameon: Show the legend frameframealpha:The alpha transparency of the legend’s background.fancybox: Rounded edges of the legend frameshadow: Shadow behind the legend
Show the legend frame (frameon)
frameon=Falsehides the legend frame
# step4 Set a legend
ax.legend(frameon=False)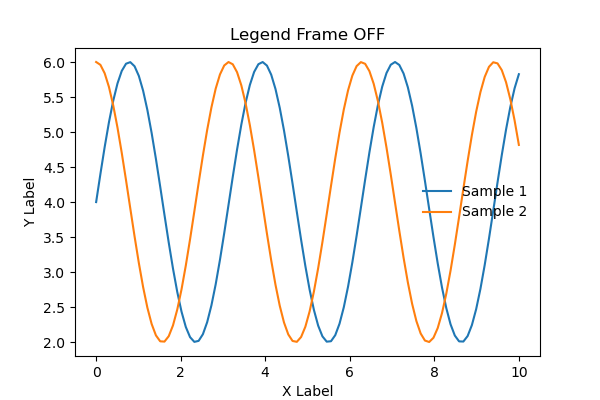
Alpha transparency (framealpha)
framealpha specifies the transparency of the legend from 0~1.
0 : transparent, 1 : non-transparent
# step4 Set a legend
ax.legend(framealpha=1)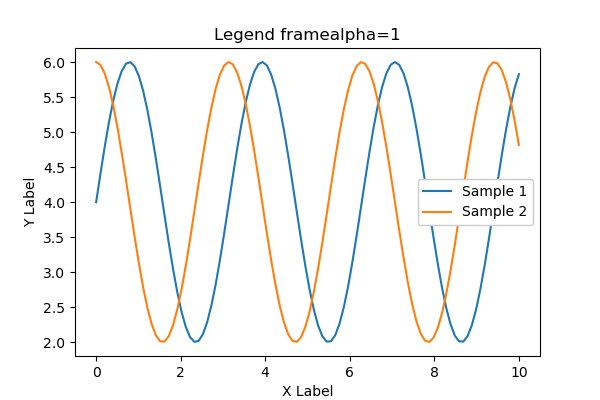
Rounded edges (fancybox)
fancybox=False removes the rounded edges of the legend and produces a rectangle with corners.
# step4 Set a legend
ax.legend(fancybox=False)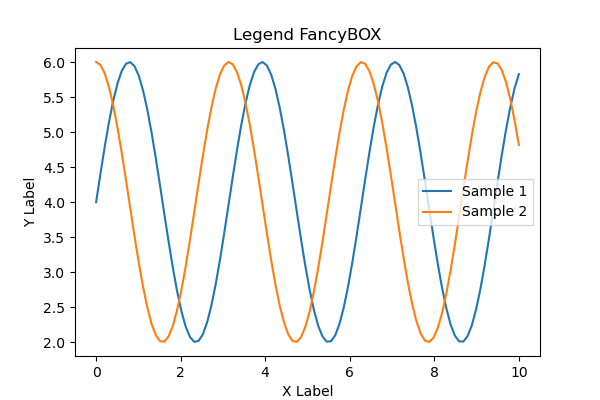
Shadow behind (shadow)
shadow=True puts a shadow behind the legend.
# step4 Set a legend
ax.legend(shadow=True)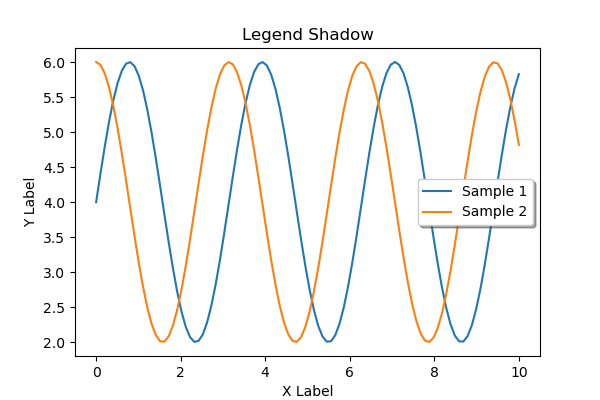
Comments