When you create a graph in Matplotlib in Python, do you have a hard time getting the graph appearance right every time?
Actually, Matplotlib provides a library called rcParams that allows you to set the appearance of a graph all at once!
By combining this library with the class-based description method, you can eliminate the need to set the graph appearance every time!
This article focuses on the presentation of scientific papers, and explains how to use classes to set up the presentation in a batch.
The code can be used as is by copying and pasting, so please try it on your own PC!
Line chart (Axes.plot)
To display a line graph (or scatter plot) in Matplotlib, use the Axes.plot function
Entering only y in Axes.plot displays y values at equal intervals on the graph, but entering both x and y results in an x versus y graph, as in a scatter plot.
- Parameters
-
- x, y (array-like or scalar) : The horizontal / vertical coordinates of the data points. If only y is specified, then x is an array of [number 0~y].
- fmt (str) : The format string can specify the line type, line color, and marker at once.
- label (array) : Label
- linestyle (str) : Line style, select from the following [- (solid), — (dashed), -. (dashdot), : (dotted), (None)]
- linewidth (float) : The line width.
- alpha (float) : Specify transparency as a number in the range 0~1
- marker (str) : Marker Type. Enter the string listed in matplotlib.markers
- markerfacecolor (color) : Main color of marker
- markeredgecolor (color) : Color of the marker’s border
- markeredgewidth (float) : Marker frame width
- fillstyle (str) : Marker Fill Area. Choose from full, left, right, bottom, top, none
- Returns
-
- list of Line2D
- Official Documentation
Line chart with Axes.plot
Axes.plot function displays a line chart
The following tabs explain with codes and flowcharts.
import matplotlib.pyplot as plt
import numpy as np

class ThesisFormat:
    def __init__(self) -> None:
        self.plt_style()

    def plt_style(self):
        plt.rcParams['figure.autolayout'] = True
        plt.rcParams['figure.figsize'] = [6.4, 4.8]
        plt.rcParams['font.family'] ='Times New Roman'
        plt.rcParams['font.size'] = 12
        plt.rcParams['xtick.direction'] = 'in'
        plt.rcParams['ytick.direction'] = 'in'
        plt.rcParams['axes.linewidth'] = 1.0
        plt.rcParams['errorbar.capsize'] = 6
        plt.rcParams['lines.markersize'] = 6
        plt.rcParams['lines.markerfacecolor'] = 'white'
        plt.rcParams['mathtext.fontset'] = 'cm'
        self.line_styles = ['-', '--', '-.', ':']
        self.markers = ['o', 's', '^', 'D', 'v', '<', '>', '1', '2', '3']

    def plt_line(self):
        x = np.linspace(0, 10, 100)
        y1 = 4 + 2 * np.sin(2 * x)
        y2 = 4 + 2 * np.cos(2 * x)

        fig, ax = plt.subplots()

        ax.plot(x, y1, linestyle=self.line_styles[0], label='Sample 1')
        ax.plot(x, y2, linestyle=self.line_styles[1], label='Sample 2')

        ax.set_xlim(0, 8)
        ax.set_ylim(0, 8)
        ax.set_xlabel('X label')
        ax.set_ylabel('Y label')
        ax.legend()

        ax.set_title('Simple line')

        plt.show()

if __name__ == '__main__':
    thesis_format = ThesisFormat()
    thesis_format.plt_line()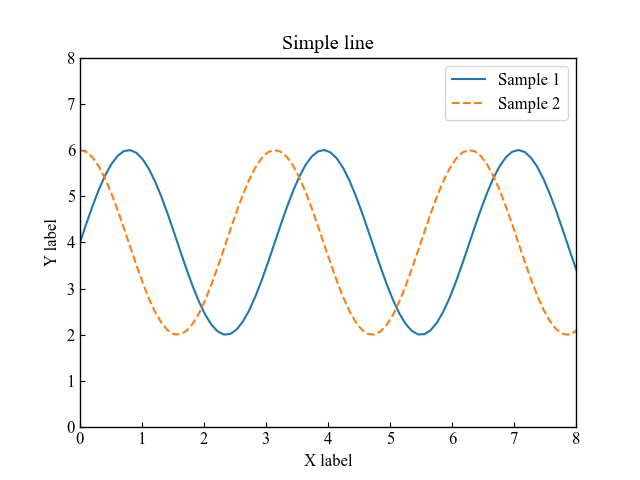
Line chart with markers with Axes.plot
To display a line chart with markers with the Axes.plot function, specify the markers
The line type and marker are specified in fmt (format string)
Also, plt.rcParams['lines.markerfacecolor'] = 'whiteto paint the line white.
import matplotlib.pyplot as plt
import numpy as np

class ThesisFormat:
    def __init__(self) -> None:
        self.plt_style()

    def plt_style(self):
        plt.rcParams['figure.autolayout'] = True
        plt.rcParams['figure.figsize'] = [6.4, 4.8]
        plt.rcParams['font.family'] ='Times New Roman'
        plt.rcParams['font.size'] = 12
        plt.rcParams['xtick.direction'] = 'in'
        plt.rcParams['ytick.direction'] = 'in'
        plt.rcParams['axes.linewidth'] = 1.0
        plt.rcParams['errorbar.capsize'] = 6
        plt.rcParams['lines.markersize'] = 6
        plt.rcParams['lines.markerfacecolor'] = 'white'
        plt.rcParams['mathtext.fontset'] = 'cm'
        self.line_styles = ['-', '--', '-.', ':']
        self.markers = ['o', 's', '^', 'D', 'v', '<', '>', '1', '2', '3']

    def plt_line_marker(self):
        x = np.linspace(0, 10, 30)
        y1 = 4 + 2 * np.sin(2 * x)
        y2 = 4 + 2 * np.cos(2 * x)

        fig, ax = plt.subplots()

        ax.plot(x, y1, self.markers[0]+'--', label='Sample 1')
        ax.plot(x, y2, self.markers[1]+'--', label='Sample 2')

        ax.set_xlim(0, 8)
        ax.set_ylim(0, 8)
        ax.set_ylabel('Y label')
        ax.set_xlabel('X label')
        ax.legend()

        ax.set_title('Markered line')
        fig.suptitle('Fig Title')

        plt.show()

if __name__ == '__main__':
    thesis_format = ThesisFormat()
    thesis_format.plt_line_marker()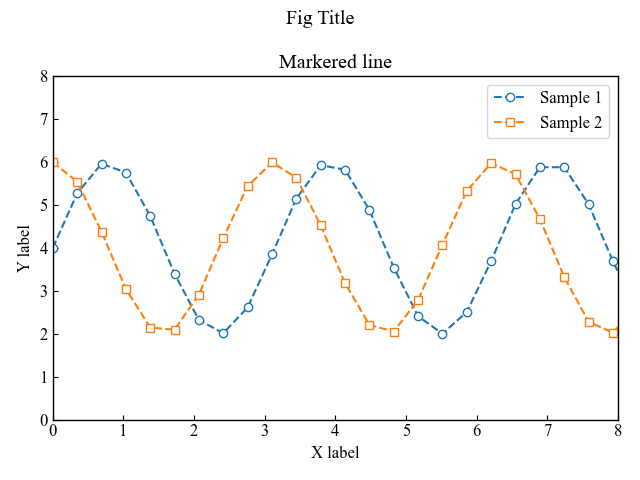

Scatter plot with legend outside the graph (Axes.scatter)
The Axes.scatter function can be used to draw scatter plots
The data is an array with the same number of elements for x and y, respectively.
- Parameters
-
- x, y (float or array) : The data positions.
- s (float or array) : The marker size in points**2.
- c (color) : The marker colors. Enter a string or RGB for the specified color, or an array of numbers if cmap is specified.
- marker (MarkerStyle) : The marker style. There are two main types of systems: filled and unfilled.
- cmap (Colormap) : The Colormap instance or registered colormap name used to map scalar data to colors. This parameter is ignored if c is RGB(A).
- vmax, vmin (float) : vmin and vmax define the data range that the colormap covers.
- alpha (float) : The alpha blending value, between 0 (transparent) and 1 (opaque).
- linewidths (float or array) : The linewidth of the marker edges.
- edgecolor (color) : The edge color of the marker.
- Returns
- Official Documentation
Scatter plots with transparency (alpha)
When there are multiple elements in a scatter plot, it is important to make it easy to recognize them even if they overlap!
Therefore, we have added transparency to the markers so that the overlap can be clearly seen.
The following tabs explain plt_scatter and flowchart
import matplotlib.pyplot as plt
import numpy as np

class ThesisFormat:
    def __init__(self) -> None:
        self.plt_style()

    def plt_style(self):
        plt.rcParams['figure.autolayout'] = True
        plt.rcParams['figure.figsize'] = [6.4, 4.8]
        plt.rcParams['font.family'] ='Times New Roman'
        plt.rcParams['font.size'] = 12
        plt.rcParams['xtick.direction'] = 'in'
        plt.rcParams['ytick.direction'] = 'in'
        plt.rcParams['axes.linewidth'] = 1.0
        plt.rcParams['errorbar.capsize'] = 6
        plt.rcParams['lines.markersize'] = 6
        plt.rcParams['lines.markerfacecolor'] = 'white'
        plt.rcParams['mathtext.fontset'] = 'cm'
        self.line_styles = ['-', '--', '-.', ':']
        self.markers = ['o', 's', '^', 'D', 'v', '<', '>', '1', '2', '3']

    def plt_scatter(self):
        np.random.seed(19680801)

        x = np.random.randn(100)
        y1 = np.random.randn(100)
        y2 = np.random.randn(100)

        fig, ax = plt.subplots()

        ax.scatter(x, y1, alpha=0.5, label='Sample1')
        ax.scatter(x, y2, alpha=0.5, label='Sample2', marker=self.markers[1])

        ax.set_ylabel('Y label')
        ax.set_xlabel('X label')
        ax.legend(bbox_to_anchor=(1.05, 1), loc='upper left')
        ax.set_title('Simple scatter')

        plt.show()

if __name__ == '__main__':
    thesis_format = ThesisFormat()
    thesis_format.plt_scatter()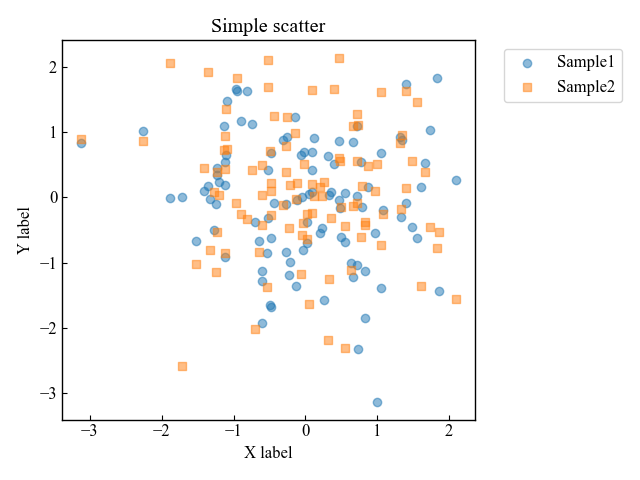
Scatter plots of frame color only (edgecolor)
It is often the case that a scatterplot with multiple elements makes the graph look unattractive.
It is therefore possible to stop filling and use only the color of the border!
import matplotlib.pyplot as plt
import numpy as np

class ThesisFormat:
    def __init__(self) -> None:
        self.plt_style()

    def plt_style(self):
        plt.rcParams['figure.autolayout'] = True
        plt.rcParams['figure.figsize'] = [6.4, 4.8]
        plt.rcParams['font.family'] ='Times New Roman'
        plt.rcParams['font.size'] = 12
        plt.rcParams['xtick.direction'] = 'in'
        plt.rcParams['ytick.direction'] = 'in'
        plt.rcParams['axes.linewidth'] = 1.0
        plt.rcParams['errorbar.capsize'] = 6
        plt.rcParams['lines.markersize'] = 6
        plt.rcParams['lines.markerfacecolor'] = 'white'
        plt.rcParams['mathtext.fontset'] = 'cm'
        self.line_styles = ['-', '--', '-.', ':']
        self.markers = ['o', 's', '^', 'D', 'v', '<', '>', '1', '2', '3']

    def plt_scatter_edge(self):
        np.random.seed(19680801)

        x = np.random.randn(100)
        num = 5
        ys = [np.random.randn(100) for _ in range(num)]

        fig, ax = plt.subplots()

        for i, y in enumerate(ys):
            ax.scatter(x, y, label='Sample '+str(i+1), c='white', edgecolor='C'+str(i), marker=self.markers[i])

        ax.set_ylabel('Y label')
        ax.set_xlabel('X label')
        ax.legend(bbox_to_anchor=(1.05, 1), loc='upper left')
        ax.set_title('Edgecolor scatter')

        plt.show()

if __name__ == '__main__':
    thesis_format = ThesisFormat()
    thesis_format.plt_scatter_edge()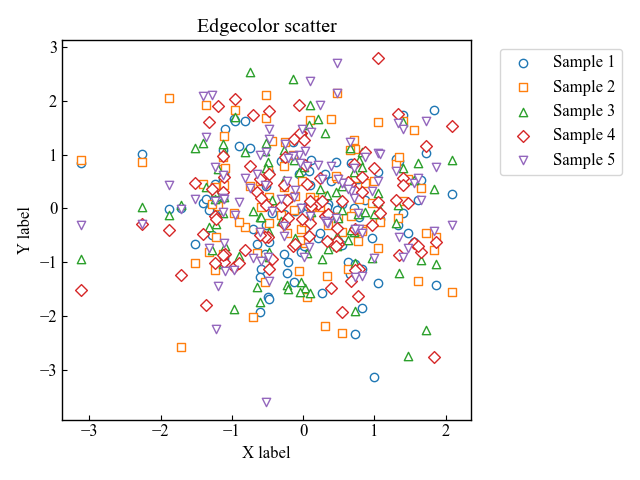

Bar graph (Axes.bar, Axes.bar_label)
The Axes.bar function displays a bar graph.
As long as the y height of the bar graph is high enough, it can be drawn.
- Parameters
-
- x (float or array) : The x coordinates of the bars.
- height (float or array) : The height(s) of the bars.
- width (float or array) : The width(s) of the bars.
- bottom (float or array) : The y coordinate(s) of the bottom side(s) of the bars.
- align (str) : Alignment of the bars to the x coordinates, center or edge
- xerr, yerr (float or array) : Add horizontal / vertical errorbars to the bar tips.
- color (color or list of color) : The colors of the bar faces.
- edgecolor (color or list of color) : The colors of the bar edges.
- linewidth (float) : Width of the bar edge(s). If 0, don’t draw edges.
- ecolor (color or list of color) : The line color of the errorbars.
- capsize (float) : The length of the error bar caps in points. In this article, it is unified as plt.rcParams[‘errorbar.capsize’] = 3.
- log (bool) : if True, Logarithmic scale
- Returns
- Official Documentation
General bar graph with labels
Draws the most common labeled bar graph with only one data
The following tabs explain plt_bar and flowcharts
import matplotlib.pyplot as plt
import numpy as np

class ThesisFormat:
    def __init__(self) -> None:
        self.plt_style()

    def plt_style(self):
        plt.rcParams['figure.autolayout'] = True
        plt.rcParams['figure.figsize'] = [6.4, 4.8]
        plt.rcParams['font.family'] ='Times New Roman'
        plt.rcParams['font.size'] = 12
        plt.rcParams['xtick.direction'] = 'in'
        plt.rcParams['ytick.direction'] = 'in'
        plt.rcParams['axes.linewidth'] = 1.0
        plt.rcParams['errorbar.capsize'] = 6
        plt.rcParams['lines.markersize'] = 6
        plt.rcParams['lines.markerfacecolor'] = 'white'
        plt.rcParams['mathtext.fontset'] = 'cm'
        self.line_styles = ['-', '--', '-.', ':']
        self.markers = ['o', 's', '^', 'D', 'v', '<', '>', '1', '2', '3']

    def plt_bar(self):
        labels = ['G1', 'G2', 'G3', 'G4', 'G5']
        men_means = [20, 34, 30, 35, 27]
        men_std = [2, 3, 4, 1, 2]

        x = np.arange(len(labels))

        fig, ax = plt.subplots()
        bar = ax.bar(x, men_means, label='Men', tick_label=labels, yerr=men_std)

        labels = [str(m) + ' ± ' + str(s) for m, s in zip(men_means, men_std)]
        ax.bar_label(bar, labels=labels)

        ax.set_xlabel('X label')
        ax.set_ylabel('Y label')
        ax.set_title('Basic bar')
        ax.legend()

        plt.show()

if __name__ == '__main__':
    thesis_format = ThesisFormat()
    thesis_format.plt_bar()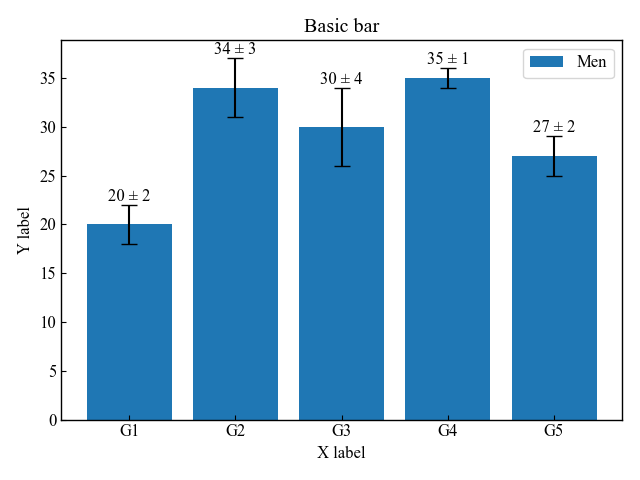
Grouped and Stacked bar graphs
Grouped bar graph : Specify width to adjust the position.
Stacked bar graph : Specify bottom to change the starting point of the second set of data.
The following tabs explain plt_bar_group_stack and the flowchart
import matplotlib.pyplot as plt
import numpy as np

class ThesisFormat:
    def __init__(self) -> None:
        self.plt_style()

    def plt_style(self):
        plt.rcParams['figure.autolayout'] = True
        plt.rcParams['figure.figsize'] = [6.4, 4.8]
        plt.rcParams['font.family'] ='Times New Roman'
        plt.rcParams['font.size'] = 12
        plt.rcParams['xtick.direction'] = 'in'
        plt.rcParams['ytick.direction'] = 'in'
        plt.rcParams['axes.linewidth'] = 1.0
        plt.rcParams['errorbar.capsize'] = 6
        plt.rcParams['lines.markersize'] = 6
        plt.rcParams['lines.markerfacecolor'] = 'white'
        plt.rcParams['mathtext.fontset'] = 'cm'
        self.line_styles = ['-', '--', '-.', ':']
        self.markers = ['o', 's', '^', 'D', 'v', '<', '>', '1', '2', '3']

    def plt_bar_group_stack(self):
        labels = ['G1', 'G2', 'G3', 'G4', 'G5']
        men_means = [20, 34, 30, 35, 27]
        women_means = [25, 32, 34, 20, 25]

        x = np.arange(len(labels))
        width = 0.4

        fig, axs = plt.subplots(1, 2, sharey=True)
        # Grouped bar graphs
        group1 = axs[0].bar(x - width/2, men_means, width, label='Men')
        group2 = axs[0].bar(x + width/2, women_means, width, label='Women')

        # Stacked bar graphs
        stack1 = axs[1].bar(labels, men_means, width, label='Men')
        stack2 = axs[1].bar(labels, women_means, width, bottom=men_means, label='Women')

        # Labels of the grouped bar graphs
        axs[0].bar_label(group1, labels=men_means)
        axs[0].bar_label(group2, labels=women_means)

        # Labels of the stacked bar graphs
        axs[1].bar_label(stack1, fmt='%.1f')
        axs[1].bar_label(stack2, fmt='%.1f')

        axs[0].set_ylabel('Y label')
        axs[0].set_title(f'Grouped Bar')
        axs[1].set_title(f'Stacked Bar')

        for ax in axs.flat:
            ax.set_xticks(x, labels)
            ax.set_xlabel('X label')
            ax.legend()

        fig.suptitle('Bar for a Thesis')
        plt.show()

if __name__ == '__main__':
    thesis_format = ThesisFormat()
    thesis_format.plt_bar_group_stack()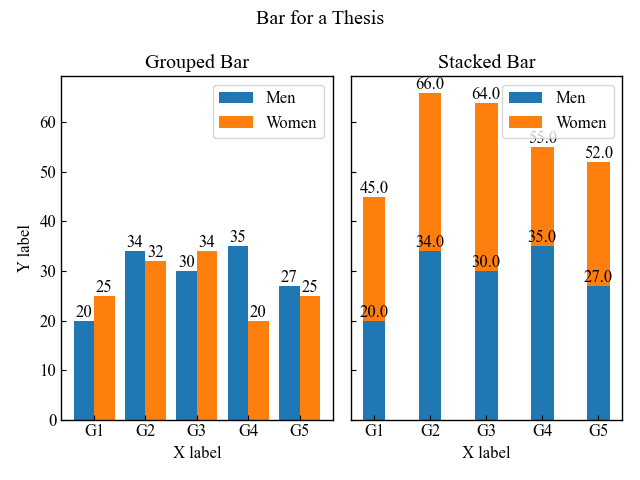

Step graph (Axes.step)
The Axes.step function plots a step graph.
- Parameters
-
- x (array):1D sequence of x positions.
- y (array):1D sequence of y levels.
- fmt (str):A format string, in the order of [marker][line][color] (ob: blue circle)
- where:Define where the steps should be placed, Specify one of the ‘pre’, ‘post’, or ‘mid’.
- Returns
-
- list of Line2D
- Official Documentation
import matplotlib.pyplot as plt
import numpy as np

class ThesisFormat:
    def __init__(self) -> None:
        self.plt_style()

    def plt_style(self):
        plt.rcParams['font.family'] ='Times New Roman'
        plt.rcParams['xtick.direction'] = 'in'
        plt.rcParams['ytick.direction'] = 'in'
        plt.rcParams['font.size'] = 12
        plt.rcParams['axes.linewidth'] = 1.0
        plt.rcParams['errorbar.capsize'] = 6
        plt.rcParams['lines.markersize'] = 7
        plt.rcParams['mathtext.fontset'] = 'cm'
        self.line_styles = ['-', '--', '-.', ':']
        self.markers = ['o', ',', '.', 'v', '^', '<', '>', '1', '2', '3', '.', ',', 'o', 'v', '^', '<', '>', '1', '2', '3']

    def plt_step(self):
        # step1 Create data
        x = np.arange(10)
        y = np.sin(x)

        # step2 Create graph frames
        fig, ax = plt.subplots()

        # step3 Plot step graphs
        ax.step(x, y, 'o-' ,label='circle')
        ax.step(x, y+2, 's-' ,label='square')
        ax.step(x, y+4, '^-' ,label='triangle_up')

        ax.set_xlabel('X label')
        ax.set_ylabel('Y label')
        ax.legend()
        ax.set_title('Step Line Chart')

        plt.show()

if __name__ == '__main__':
    thesis_format = ThesisFormat()
    thesis_format.plt_step()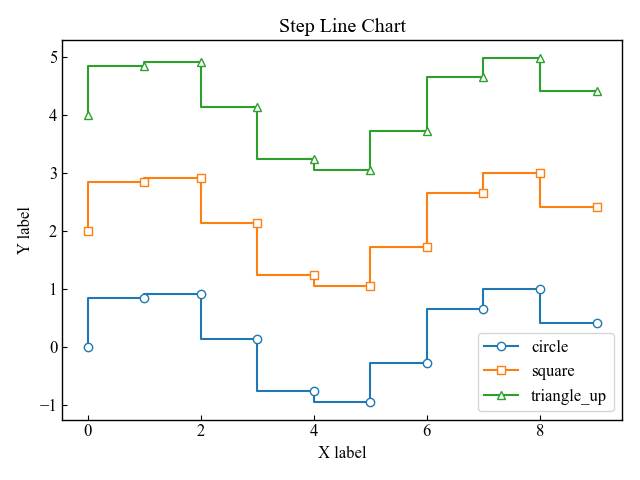

Pie chart (axes.pie)
The Axes.pie function plots a pie chart.
- Parameters
-
- x (1D-array) : The wedge sizes
- explode (array) : Percentage distance of each element from the center of the graph
- labels (list : A sequence of strings providing the labels for each wedge
- colors (list of color) : A sequence of colors through which the pie chart will cycle.
- autopct (str) : autopct is a string or function used to label the wedges with their numeric value.
- pctdistance (float) : The relative distance along the radius at which the text generated by autopct is drawn.
- shadow (bool) : If bool, whether to draw a shadow beneath the pie.
- labeldistance (float) : The relative distance along the radius at which the labels are drawn.
- counterclock (bool) : Specify fractions direction, clockwise or counterclockwise.
- startangle (float) : The angle by which the start of the pie is rotated, counterclockwise from the x-axis.
- radius (float) : The radius of the pie.
- wedgeprops (dict) : Dict of arguments passed to each patches.Wedge of the pie.
- textprops (dict) : Dict of arguments to pass to the text objects.
- center ((float, float)) : The coordinates of the center of the chart
- frame (bool) : Plot Axes frame with the chart if true.
- rotatelabels (bool) : Rotate each label to the angle of the corresponding slice if true.
- normalize (bool) : When True, always make a full pie by normalizing x so that
sum(x) == 1.
- Returns
-
- patches (list) : A sequence of matplotlib.patches.Wedge instances
- texts (list) : A list of the label Text instances.
- autotexts (list) : A list of Text instances for the numeric labels.
- Official Documentation
The following tabs explain with codes and flowchart.
import matplotlib.pyplot as plt
import numpy as np

class ThesisFormat:
    def __init__(self) -> None:
        self.plt_style()

    def plt_style(self):
        plt.rcParams['figure.autolayout'] = True
        plt.rcParams['figure.figsize'] = [6.4, 4.8]
        plt.rcParams['font.family'] ='Times New Roman'
        plt.rcParams['font.size'] = 12
        plt.rcParams['xtick.direction'] = 'in'
        plt.rcParams['ytick.direction'] = 'in'
        plt.rcParams['axes.linewidth'] = 1.0
        plt.rcParams['errorbar.capsize'] = 6
        plt.rcParams['lines.markersize'] = 6
        plt.rcParams['lines.markerfacecolor'] = 'white'
        plt.rcParams['mathtext.fontset'] = 'cm'
        self.line_styles = ['-', '--', '-.', ':']
        self.markers = ['o', 's', '^', 'D', 'v', '<', '>', '1', '2', '3']

    def plt_circle(self):
        labels = ['A', 'B', 'C', 'D']
        sizes = [15, 30, 45, 10]

        fig, ax = plt.subplots()
        # Specify a colormap
        cmap = plt.colormaps['viridis']
        colors = cmap((np.linspace(0.4, 0.9, len(sizes))))
        # Plot a pie chart
        ax.pie(sizes, labels=labels, autopct='%.0f%%', startangle=90, counterclock=False, normalize=True,
            colors=colors,
            wedgeprops = {'edgecolor': 'white', 'linewidth': 1.2},
            textprops={'fontsize': 17, 'fontweight': 'bold', 'family': 'Times new roman'}
        )

        ax.set_title('circle plot for a thesis')
        ax.legend(loc='center left', bbox_to_anchor=(1, 0, 0.5, 1))

        plt.show()

if __name__ == '__main__':
    thesis_format = ThesisFormat()
    thesis_format.plt_circle()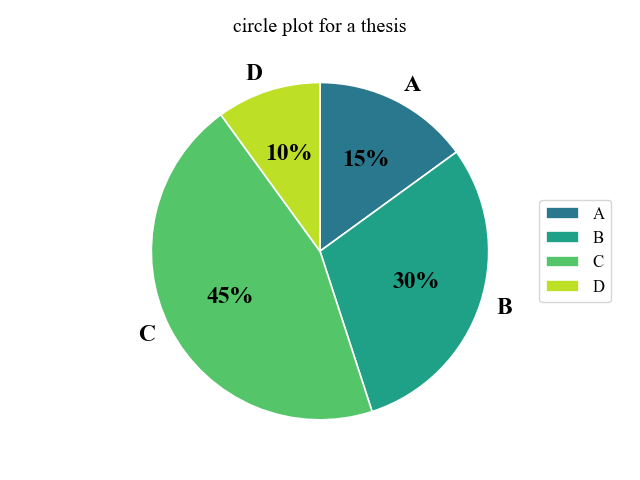

Contour graph (Axes.contour)
Axes.contour function plots a contour graph
X and Y are 160-by-240 matrices processed by the numpy.meshgrid function.
Z is a 160-by-240 matrix of contour heights created from the grid data.
- Parameters
-
- X (array) : The coordinates of the values in Z.
- Y (array) : X and Y must both be 2D with the same shape as Z.
- Z (array) : The height values over which the contour is drawn.
- levels (int or array) : Determines the number and positions of the contour lines / regions.
- Returns
- Official Documentation
The following tabs describe plt_contour, graph data and flowcharts.
import matplotlib.pyplot as plt
import numpy as np

class ThesisFormat:
    def __init__(self) -> None:
        self.plt_style()

    def plt_style(self):
        plt.rcParams['figure.autolayout'] = True
        plt.rcParams['figure.figsize'] = [6.4, 4.8]
        plt.rcParams['font.family'] ='Times New Roman'
        plt.rcParams['font.size'] = 12
        plt.rcParams['xtick.direction'] = 'in'
        plt.rcParams['ytick.direction'] = 'in'
        plt.rcParams['axes.linewidth'] = 1.0
        plt.rcParams['errorbar.capsize'] = 6
        plt.rcParams['lines.markersize'] = 6
        plt.rcParams['lines.markerfacecolor'] = 'white'
        plt.rcParams['mathtext.fontset'] = 'cm'
        self.line_styles = ['-', '--', '-.', ':']
        self.markers = ['o', 's', '^', 'D', 'v', '<', '>', '1', '2', '3']

    def plt_contour(self):
        delta = 0.025
        x = np.arange(-3.0, 3.0, delta)
        y = np.arange(-2.0, 2.0, delta)
        X, Y = np.meshgrid(x, y)
        Z1 = np.exp(-X**2 - Y**2)
        Z2 = np.exp(-(X - 1)**2 - (Y - 1)**2)
        Z = Z1 - Z2

        fig, ax = plt.subplots()
        # Contour labels
        CS = ax.contour(X, Y, Z, colors='black')
        ax.clabel(CS, inline=True)

        # Contour Fill
        CSf = ax.contourf(X, Y, Z)

        # Set the color bar
        cbar = fig.colorbar(CSf)
        cbar.ax.set_ylabel('Z Label')
        cbar.add_lines(CS)

        ax.set_xlabel('X Label')
        ax.set_ylabel('Y Label')
        ax.set_title('Simple Contour')
        plt.show()

if __name__ == '__main__':
    thesis_format = ThesisFormat()
    thesis_format.plt_contour()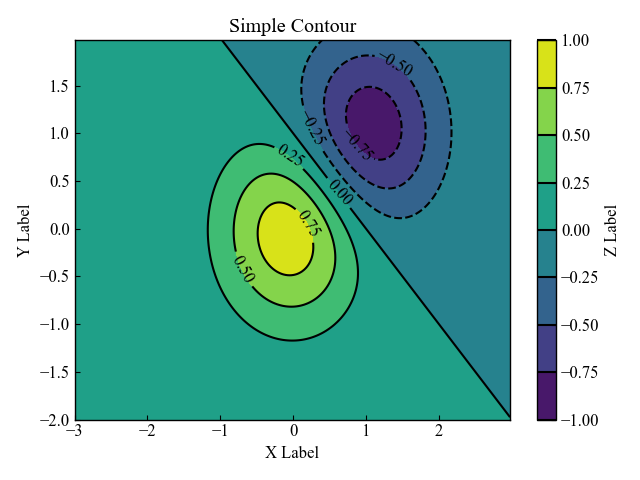

How to plot graphs using a class (matplotlib.rcParams)
matplotlib.rcParams is used to apply the paper’s graph format to various classes.
The classes are very difficult to understand, so I will explain how the code works.
We use the case of a line graph with the Axes.plot function as an example.
Parts of a class
The class is called ThesisFormat and has three functions
There are no arguments, only self, which is the class itself.
Using self, any function in the class can be used.
- Class
-
- ThesisFormat
- Function
-
- __init__(self) : The first function executed when the class is called
- plt_style(self) : Function to arrange the appearance of a graph in a batch.
- plt_line(self) : Functions to plot graphs
Call a class and Plot a graph
if name == 'main': The following calls the class and executes the graph drawing.
- Call a class
-
- class and replaces it with a variable named thesis_format
- Plot a graph
-
- Execute the function plt_line() in the class to draw the graph
References
matplotlib.rcParams


Comments