-
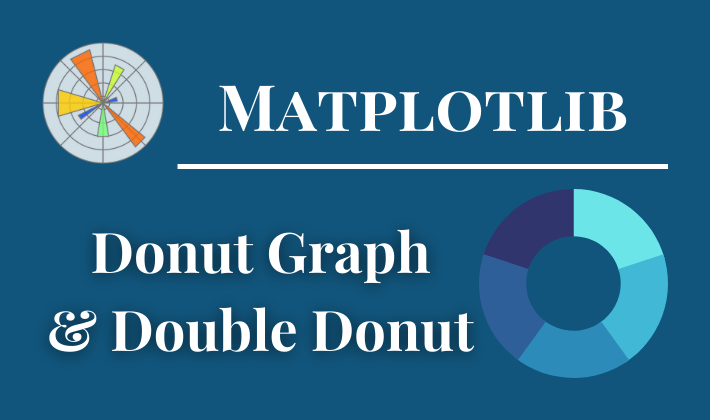
Matplotlib | Donut graph! Percentage % in the center (pie, text)
A pie chart is often used to display data proportions, but for a more modern design, a doughnut graph is sometimes used by hollowing out the center of the pi... -
Python+VSCode+Windows 11 environment! A must for beginners!
Python is one of the most popular programming languages in the world! It is very easy to use for AI, machine learning, and data analysis because of its exten... -
Matplotlib | Stacked area charts and Stream graphs (stackplot)
Stacked area graphs are an extension of the basic area graph The values of each group are displayed on top of each other, so you can see the sum of the value... -
Matplotlib | Plot scatter and bubble charts (scatter)
Do you want to visualize the relationships and distribution of your data by creating scatter and bubble charts, but you are not sure how to achieve this? May... -
Matplotlib | Line graphs and scatter plots! Line type, marker, color (plot)
Have you ever wanted to draw a graph to visualize data in Python? Python has an excellent library for creating graphs called Matplotlib This article describe... -
Matplotlib | Plot bar charts and their options (bar, barh, bar_label)
Bar charts are a very common and popular method of data visualization Matplotlib makes it easy to plot bar charts with just a few lines of code. This article... -
Matplotlib | Plot contour plots with color bars (contour, contourf, plot_surface)
Are you having trouble creating contour plots? To accurately represent the density and patterns in your data, you need to create contour plots the right way!... -
Matplotlib | Stem plots with easy to understand frequency distribution (stem)
Have you ever plotted a frequency distribution chart using a histogram, but found it difficult to understand or not visually appealing? In such cases, using ... -
Matplotlib | Plot infinitely long lines or bars (hlines, vlines, axhline, axvline, axline, axhspan, axvspan)
Are you struggling with how to display straight lines and band lines on a graph? If you want to highlight specific data points or ranges, it is important to ... -
Matplotlib | Fill an area in a graph (fill_between, fill_betweenx)
When plotting a graph in Python's Matplotlib, have you ever wanted to fill in areas of the graph? This is often the case when you want to show a range or an ...

