\ 迷ったらまずTechAcademyの無料カウンセリング! /
【Matplotlib】レーダーチャートを表示する方法 (RadarTransform, RadarAxes)

レーダーチャートは複数の項目を正多角形上に表現したグラフになります.各項目のデータのバランスを確認する際によく用いられます.
PythonのMatplotlibでは,このレーダーチャートを表示するための専用の関数は用意されておらず,クラスとして描画する方法が紹介されています.
そこで本記事では,そのクラスで描画する方法について詳しく解説し,Matplotlibでレーダーチャートを簡単に表示する方法を解説します.
また,クラスを用いてレーダーチャートを表示するため,クラスの基本的な仕組みから各関数の役割まで説明しています.
レーダーチャートを簡単に表示する
PythonのMatplotlibでは,レーダーチャートを表示するための専用の関数は用意されておらず,クラスを用いて描画します
まず,用意されたデータを用いて,グラフの数を変更しながらレーダーチャートを簡単に表示させます
4つのシナリオでの5因子の関連性を表現する
公式ドキュメントで紹介されているレーダーチャートは,4つのシナリオを想定した際の5因子の関連性を表現しています
関数example_data()に5行9列のデータが4種類格納されており,関数radar_factory()を用いてレーダーチャートを表示しています
import numpy as np

import matplotlib.pyplot as plt
from matplotlib.patches import Circle, RegularPolygon
from matplotlib.path import Path
from matplotlib.projections.polar import PolarAxes
from matplotlib.projections import register_projection
from matplotlib.spines import Spine
from matplotlib.transforms import Affine2D


def radar_factory(num_vars, frame='circle'):
    """

    num_vars(int型)の軸を持つレーダーチャートを作成する.

    この関数は,RadarAxesプロジェクションを作成し,登録する.

    Parameters
    ----------
    num_vars : int
        レーダーチャート用の変数の数
    frame : {'circle', 'polygon'}
        軸を囲む枠の形状

    """
    # 軸角を均等にする
    theta = np.linspace(0, 2*np.pi, num_vars, endpoint=False)

    class RadarTransform(PolarAxes.PolarTransform):

        def transform_path_non_affine(self, path):
            # 非単位の補間ステップを持つパスはグリッドラインに対応し,
            # (PolarTransformの円弧への自動変換を無効にするために)補間を強制する
            if path._interpolation_steps > 1:
                path = path.interpolated(num_vars)
            return Path(self.transform(path.vertices), path.codes)

    class RadarAxes(PolarAxes):

        name = 'radar'
        # 指定した点間を1本の線分で結ぶ
        RESOLUTION = 1
        PolarTransform = RadarTransform

        def __init__(self, *args, **kwargs):
            super().__init__(*args, **kwargs)
            # 第一軸が上になるようにプロットを回転させる
            self.set_theta_zero_location('N')

        def fill(self, *args, closed=True, **kwargs):
            """fillを上書きし、デフォルトで行を閉じるようにする"""
            return super().fill(closed=closed, *args, **kwargs)

        def plot(self, *args, **kwargs):
            """デフォルトで線が閉じるようにplotを上書きする"""
            lines = super().plot(*args, **kwargs)
            for line in lines:
                self._close_line(line)

        def _close_line(self, line):
            x, y = line.get_data()
            # FIXME: x[0],y[0]のマーカーが2倍になる
            if x[0] != x[-1]:
                x = np.append(x, x[0])
                y = np.append(y, y[0])
                line.set_data(x, y)

        def set_varlabels(self, labels):
            self.set_thetagrids(np.degrees(theta), labels)

        def _gen_axes_patch(self):
            # Axesパッチは軸座標で (0.5, 0.5) を中心とし,半径 0.5である必要がある
            if frame == 'circle':
                return Circle((0.5, 0.5), 0.5)
            elif frame == 'polygon':
                return RegularPolygon((0.5, 0.5), num_vars,
                                      radius=.5, edgecolor="k")
            else:
                raise ValueError("Unknown value for 'frame': %s" % frame)

        def _gen_axes_spines(self):
            if frame == 'circle':
                return super()._gen_axes_spines()
            elif frame == 'polygon':
                # spine_typeは必ず'left'/'right'/'top'/'bottom'/'circle'
                spine = Spine(axes=self,
                              spine_type='circle',
                              path=Path.unit_regular_polygon(num_vars))
                # unit_regular_polygon は (0, 0) を中心とする半径 1 の多角形を与える
                # しかし 軸座標で(0.5, 0.5)を中心とする半径0.5の多角形が欲しい
                spine.set_transform(Affine2D().scale(.5).translate(.5, .5)
                                    + self.transAxes)
                return {'polar': spine}
            else:
                raise ValueError("Unknown value for 'frame': %s" % frame)

    register_projection(RadarAxes)
    return theta


def example_data():
    data = [
        ['Sulfate', 'Nitrate', 'EC', 'OC1', 'OC2', 'OC3', 'OP', 'CO', 'O3'],
        ('Basecase', [
            [0.88, 0.01, 0.03, 0.03, 0.00, 0.06, 0.01, 0.00, 0.00],
            [0.07, 0.95, 0.04, 0.05, 0.00, 0.02, 0.01, 0.00, 0.00],
            [0.01, 0.02, 0.85, 0.19, 0.05, 0.10, 0.00, 0.00, 0.00],
            [0.02, 0.01, 0.07, 0.01, 0.21, 0.12, 0.98, 0.00, 0.00],
            [0.01, 0.01, 0.02, 0.71, 0.74, 0.70, 0.00, 0.00, 0.00]]),
        ('With CO', [
            [0.88, 0.02, 0.02, 0.02, 0.00, 0.05, 0.00, 0.05, 0.00],
            [0.08, 0.94, 0.04, 0.02, 0.00, 0.01, 0.12, 0.04, 0.00],
            [0.01, 0.01, 0.79, 0.10, 0.00, 0.05, 0.00, 0.31, 0.00],
            [0.00, 0.02, 0.03, 0.38, 0.31, 0.31, 0.00, 0.59, 0.00],
            [0.02, 0.02, 0.11, 0.47, 0.69, 0.58, 0.88, 0.00, 0.00]]),
        ('With O3', [
            [0.89, 0.01, 0.07, 0.00, 0.00, 0.05, 0.00, 0.00, 0.03],
            [0.07, 0.95, 0.05, 0.04, 0.00, 0.02, 0.12, 0.00, 0.00],
            [0.01, 0.02, 0.86, 0.27, 0.16, 0.19, 0.00, 0.00, 0.00],
            [0.01, 0.03, 0.00, 0.32, 0.29, 0.27, 0.00, 0.00, 0.95],
            [0.02, 0.00, 0.03, 0.37, 0.56, 0.47, 0.87, 0.00, 0.00]]),
        ('CO & O3', [
            [0.87, 0.01, 0.08, 0.00, 0.00, 0.04, 0.00, 0.00, 0.01],
            [0.09, 0.95, 0.02, 0.03, 0.00, 0.01, 0.13, 0.06, 0.00],
            [0.01, 0.02, 0.71, 0.24, 0.13, 0.16, 0.00, 0.50, 0.00],
            [0.01, 0.03, 0.00, 0.28, 0.24, 0.23, 0.00, 0.44, 0.88],
            [0.02, 0.00, 0.18, 0.45, 0.64, 0.55, 0.86, 0.00, 0.16]])
    ]
    return data


if __name__ == '__main__':
    N = 9
    theta = radar_factory(N, frame='polygon')

    data = example_data()
    spoke_labels = data.pop(0)

    fig, axs = plt.subplots(figsize=(9, 9), nrows=2, ncols=2,
                            subplot_kw=dict(projection='radar'))
    fig.subplots_adjust(wspace=0.25, hspace=0.20, top=0.85, bottom=0.05)

    colors = ['b', 'r', 'g', 'm', 'y']
    # 例題データから4つのケースを別々の軸にプロット
    for ax, (title, case_data) in zip(axs.flat, data):
        ax.set_rgrids([0.2, 0.4, 0.6, 0.8])
        ax.set_title(title, weight='bold', size='medium', position=(0.5, 1.1),
                     horizontalalignment='center', verticalalignment='center')
        for d, color in zip(case_data, colors):
            ax.plot(theta, d, color=color)
            ax.fill(theta, d, facecolor=color, alpha=0.25, label='_nolegend_')
        ax.set_varlabels(spoke_labels)

    # 左上のプロットに相対的な凡例を追加
    labels = ('Factor 1', 'Factor 2', 'Factor 3', 'Factor 4', 'Factor 5')
    legend = axs[0, 0].legend(labels, loc=(0.9, .95),
                              labelspacing=0.1, fontsize='small')

    fig.text(0.5, 0.965, '5-Factor Solution Profiles Across Four Scenarios',
             horizontalalignment='center', color='black', weight='bold',
             size='large')

    plt.show()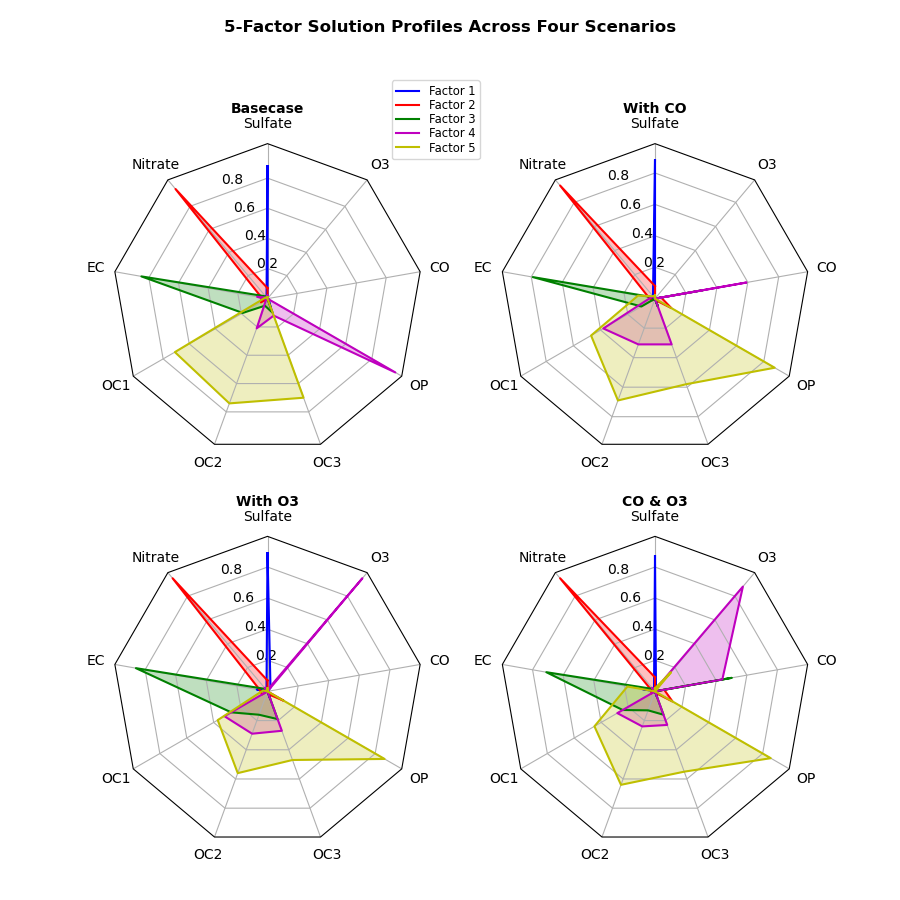
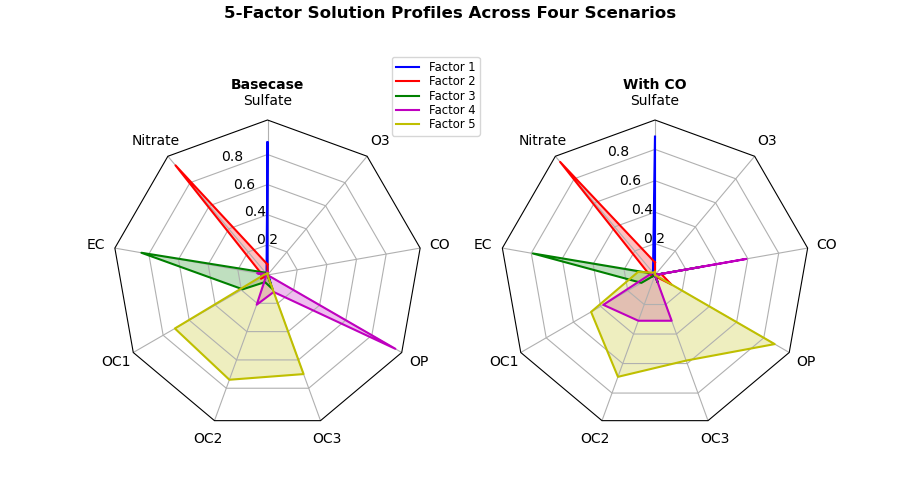
2つのシナリオでの5因子の関連性を表現する
4つから2つにシナリオを減らします.基本的に変更する箇所は if __name__ == ‘__main__’: より下部のコードだけです.
- figsize : (9, 9)→(9, 5)
- nrows : 2 → 1
- axs : [0, 0] → [0]
figsizeはどちらでもよいですが,nrowsとaxsは必須項目です.
if __name__ == '__main__':
    N = 9
    theta = radar_factory(N, frame='polygon')

    data = example_data()
    spoke_labels = data.pop(0)

    # figsize=(9, 9)→(9, 5)
    # nrows=2→1
    fig, axs = plt.subplots(figsize=(9, 5), nrows=1, ncols=2,
                            subplot_kw=dict(projection='radar'))
    fig.subplots_adjust(wspace=0.25, hspace=0.20, top=0.85, bottom=0.05)

    colors = ['b', 'r', 'g', 'm', 'y']
    # 例題データから4つのケースを別々の軸にプロット
    for ax, (title, case_data) in zip(axs.flat, data):
        ax.set_rgrids([0.2, 0.4, 0.6, 0.8])
        ax.set_title(title, weight='bold', size='medium', position=(0.5, 1.1),
                     horizontalalignment='center', verticalalignment='center')
        for d, color in zip(case_data, colors):
            ax.plot(theta, d, color=color)
            ax.fill(theta, d, facecolor=color, alpha=0.25, label='_nolegend_')
        ax.set_varlabels(spoke_labels)

    # 左上のプロットに相対的な凡例を追加
    labels = ('Factor 1', 'Factor 2', 'Factor 3', 'Factor 4', 'Factor 5')
    # axs[0, 0]→axs[0]
    legend = axs[0].legend(labels, loc=(0.9, .95),
                              labelspacing=0.1, fontsize='small')

    fig.text(0.5, 0.965, '5-Factor Solution Profiles Across Four Scenarios',
             horizontalalignment='center', color='black', weight='bold',
             size='large')

    plt.show()
1つのシナリオだけでの5因子の関連性を表現する
シンプルにレーダーチャートを1つだけ表示します.同様に変更する箇所は if __name__ == ‘__main__’: より下部のコードだけです.
- axs → ax
- nrows=2, ncols=2 → nrows=1, ncols=1
- axs[0, 0] → ax
nrows, ncolsを両方とも1に指定(もしくは指定なし)にすると,配列ではなく単一のAxesインスタンスになります.そのため,変数をaxに変えます.
データ例からの1つめのケースのみ取り出すために,title, case_data = data[0]として,for文を削除しています
if __name__ == '__main__':
    N = 9
    theta = radar_factory(N, frame='polygon')

    data = example_data()
    spoke_labels = data.pop(0)

    # axs → ax
    # nrows=2, ncols=2 → nrows=1, ncols=1
    fig, ax = plt.subplots(figsize=(9, 9), nrows=1, ncols=1,
                            subplot_kw=dict(projection='radar'))
    fig.subplots_adjust(wspace=0.25, hspace=0.20, top=0.85, bottom=0.05)

    colors = ['b', 'r', 'g', 'm', 'y']
    # データ例からの1つめのケースのみ取り出し
    title, case_data = data[0]
    ax.set_rgrids([0.2, 0.4, 0.6, 0.8])
    ax.set_title(title, weight='bold', size='medium', position=(0.5, 1.1),
                    horizontalalignment='center', verticalalignment='center')
    for d, color in zip(case_data, colors):
        ax.plot(theta, d, color=color)
        ax.fill(theta, d, facecolor=color, alpha=0.25, label='_nolegend_')
    ax.set_varlabels(spoke_labels)

    # 左上のプロットに相対的な凡例を追加
    labels = ('Factor 1', 'Factor 2', 'Factor 3', 'Factor 4', 'Factor 5')
    # axs[0, 0] → ax
    legend = ax.legend(labels, loc=(0.9, .95),
                              labelspacing=0.1, fontsize='small')

    fig.text(0.5, 0.965, '5-Factor Solution Profiles Across Four Scenarios',
             horizontalalignment='center', color='black', weight='bold',
             size='large')

    plt.show()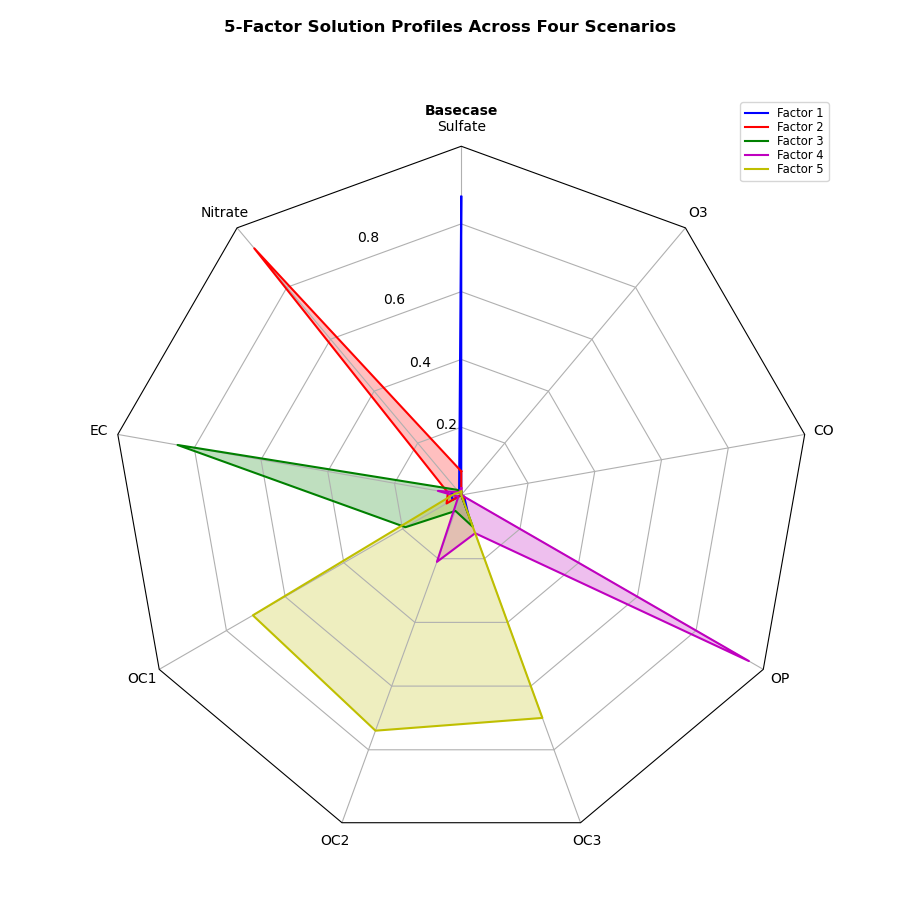
レーダーチャートのデータを入れ替える
レーダーチャートに使うデータを入れ替える方法について解説します.因子と要素をそれぞれ変更していきます.
3因子の9要素に対する関連性を表現する
レーダーチャートの因子の数を3に減らします.変更する箇所は def example_data(): の関数内部のdataだけです.
- data:[
[グラフの要素],
(グラフのシナリオタイトル), [
# 下記のグラフデータを2行削除
[グラフデータが5行入っていました],
[それを3行に変更しました],
[行数 = 因子の数]
]
]
関数 def example_data() 内のdataの行数が因子の数になります.
def example_data():
    data = [
        ['Sulfate', 'Nitrate', 'EC', 'OC1', 'OC2', 'OC3', 'OP', 'CO', 'O3'],
        ('Basecase', [
            # 2行削除
            [0.88, 0.01, 0.03, 0.03, 0.00, 0.06, 0.01, 0.00, 0.00],
            [0.07, 0.95, 0.04, 0.05, 0.00, 0.02, 0.01, 0.00, 0.00],
            [0.01, 0.01, 0.02, 0.71, 0.74, 0.70, 0.00, 0.00, 0.00]])
    ]
    return data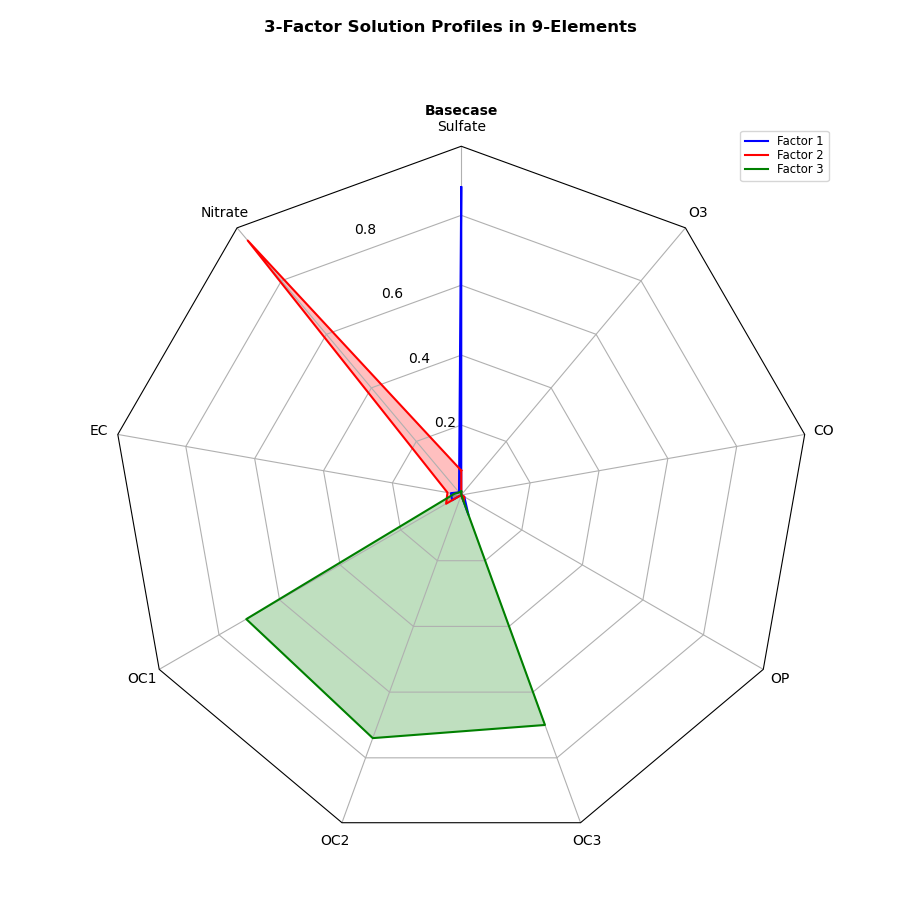
3因子の7要素に対する関連性を表現する
レーダーチャートの因子の数を3,要素の数を7に減らします.変更する箇所は def example_data(): の関数内部のdataと if __name__ == ‘__main__’: より下部のNです.
- data (def example_data():):[
# 下記のグラフの要素を2列削除
[グラフの要素を7列に変更],
(グラフのシナリオタイトル), [
# 下記のグラフデータを2列削除
[グラフデータが9列入っていました],
[それを7列に変更しました],
[列数 = 要素の数]
]
] - N (if name == ‘main’:):9 → 7
関数 def example_data() 内のdataの列数が要素の数になります.そして,if name == ‘main’: 下部のNを要素の数に合わせて変更してください.
def example_data():
    data = [
        # 2列削除
        ['Sulfate', 'Nitrate', 'EC', 'OC1', 'OC2', 'OC3', 'OP'],
        ('Basecase', [
            # 2列削除
            [0.88, 0.01, 0.03, 0.03, 0.00, 0.06, 0.01],
            [0.07, 0.95, 0.04, 0.05, 0.00, 0.02, 0.01],
            [0.01, 0.01, 0.02, 0.71, 0.74, 0.70, 0.00]])
    ]
    return data


if __name__ == '__main__':
    # 9 → 7
    N = 7
    theta = radar_factory(N, frame='polygon')

    data = example_data()
    spoke_labels = data.pop(0)

    fig, ax = plt.subplots(figsize=(9, 9), nrows=1, ncols=1,
                            subplot_kw=dict(projection='radar'))
    fig.subplots_adjust(wspace=0.25, hspace=0.20, top=0.85, bottom=0.05)

    colors = ['b', 'r', 'g', 'm', 'y']
    # example_data()からの1つめのケースのみ取り出し
    title, case_data = data[0]
    ax.set_rgrids([0.2, 0.4, 0.6, 0.8])
    ax.set_title(title, weight='bold', size='medium', position=(0.5, 1.1),
                    horizontalalignment='center', verticalalignment='center')
    for d, color in zip(case_data, colors):
        ax.plot(theta, d, color=color)
        ax.fill(theta, d, facecolor=color, alpha=0.25, label='_nolegend_')
    ax.set_varlabels(spoke_labels)

    # 左上のプロットに相対的な凡例を追加
    labels = ('Factor 1', 'Factor 2', 'Factor 3')
    legend = ax.legend(labels, loc=(0.9, .95),
                              labelspacing=0.1, fontsize='small')

    fig.text(0.5, 0.965, '3-Factor Solution Profiles in 7-Elements',
             horizontalalignment='center', color='black', weight='bold',
             size='large')

    plt.show()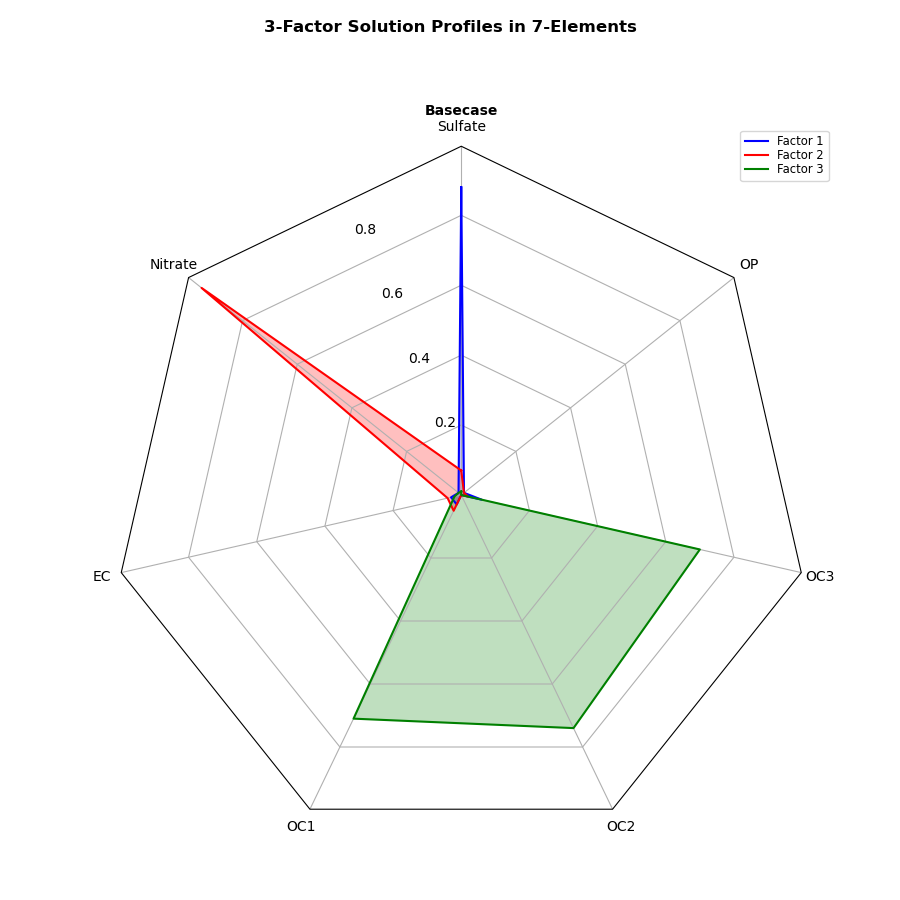
参考文献
レーダーチャートの公式ドキュメント
