\ 迷ったらまずTechAcademyの無料カウンセリング! /
【Matplotlib】度数分布がわかりやすいステムプロット(幹図)を表示 (stem)
度数分布図をプロットする際に,ヒストグラムで作成したけど,わかりづらい,見た目が良くないといったことはないでしょうか?
その際にステムプロット(幹図)を用いると,度数,ベースラインがよりわかりやすくなります
度数分布だけでなく,離散データのグラフ化にとても向いています
本記事では,PythonのMatplotlibでステムプロットを表示する方法とそのカスタマイズ方法を解説します
目次
ステムプロットのオプション一覧
ステムプロットをMatplotlibで表示するには,Axes.stem関数を使います
Axes.stem
- 引数
- 返値
- 公式ドキュメント
基本的なステムプロット (locs, heads)
折れ線グラフなどと同様に,Axes.stem関数の引数にxとyの値を1次元配列で順番に指定します
下記のタブにコードとフローチャートの解説をしています
# step0 ライブラリの読み込み
import matplotlib.pyplot as plt
import numpy as np


# step1 データの作成
x = np.linspace(0.1, 2 * np.pi, 41)
y = np.exp(np.sin(x))

# step2 グラフフレームの作成
fig, ax = plt.subplots()

# step3 ステムプロットの描画
ax.stem(x, y)

# step4 軸ラベルとリミット,タイトルの設定
ax.set_xlabel('X Label')
ax.set_ylabel('Y Label')
ax.set_xlim(0, 6)
ax.set_title('Stem demo')

# step5 Figureの呼び出し
plt.show()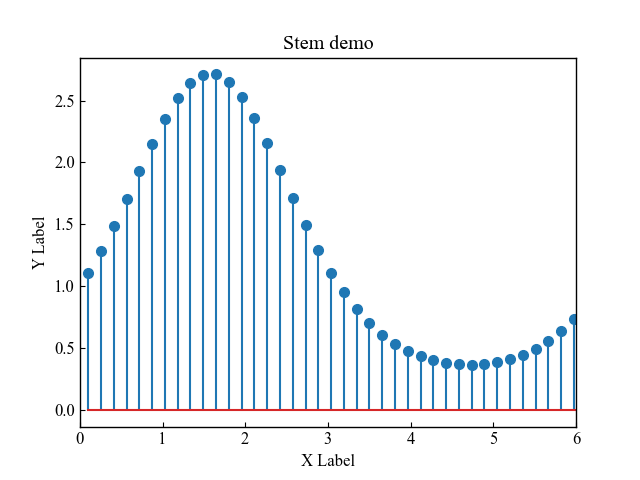
フォーマットのカスタム (linefmt, markerfmt, basefmt)
ステムプロットは大きく3つの成分あり,色や線スタイル,マーカーの種類などが変更できます
fmtとはフォーマット文字列でマーカー,線色,線種を一度に指定します
or--: o=サークル,r=赤,--=破線
ステムプロットの3成分
- 幹 (linefmt):幹の根から先までの線の箇所です
- 幹の先 (markerfmt):幹の先の点で,y座標です
- 幹の根 (basefmt):幹が生えている根本のベースラインです
幹の線 (linefmt)
linefmtは,幹の線で線のスタイルと色をカスタムしますax.stem(x, y, linefmt='--')
指定できる線のスタイルは4つです'-' : 実線'--' : 破線'-.' : 一点鎖線':' : 点線
下記のタブにコードとフローチャートの解説をしています
# step1 データの作成
x = np.linspace(0.1, 2 * np.pi, 41)
y = np.exp(np.sin(x))

# step2 グラフフレームの作成
fig, ax = plt.subplots()

# step3 ステムプロットの描画
ax.stem(x, y, linefmt='--')

# step4 軸ラベルとリミット,タイトルの設定
ax.set_xlabel('X Label')
ax.set_ylabel('Y Label')
ax.set_title('Stem LineFmt')

# step5 Figureの呼び出し
plt.show()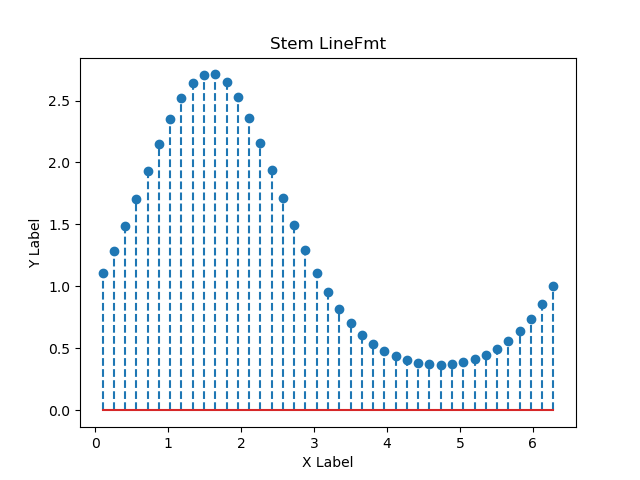
フォーマット文字列を使って,幹の線の色とスタイルを同時に指定しますlinefmt='g:':g=緑,:=点線
# step3 ステムプロットの描画
ax.stem(x, y, linefmt='g:')
幹の先のマーカー (markerfmt)
markerfmtは幹の先のマーカーをカスタムしますax.stem(x, y, markerfmt='^')
マーカーはかなりの種類があります。詳細は下記リンクを参考にしてください
# step3 ステムプロットの描画
ax.stem(x, y, markerfmt='^')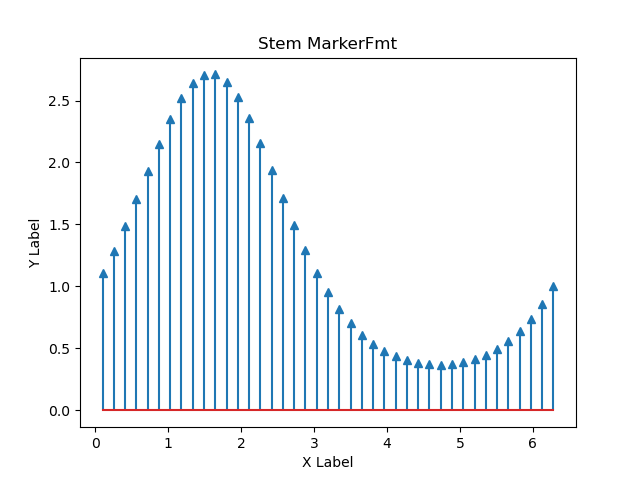
フォーマット文字列を使って,幹のマーカーの色と形状を同時に指定しますmarkerfmt='r*':r=赤,*=星
# step3 ステムプロットの描画
ax.stem(x, y, markerfmt='r*')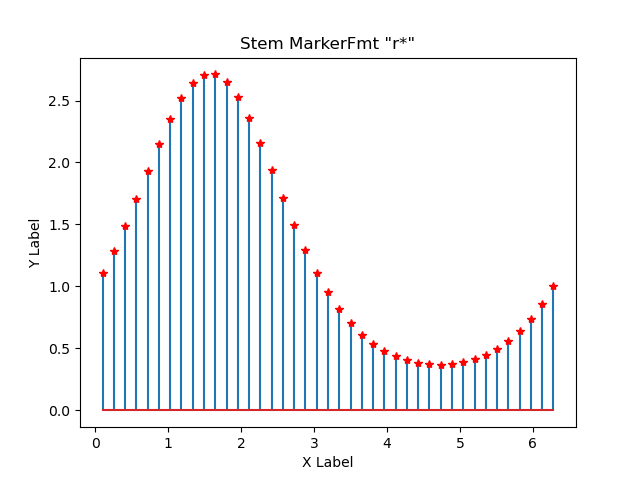
幹の根本のベースライン (basefmt)
basefmtは幹の根本のベースラインをカスタムしますax.stem(x, y, basefmt='green')
# step3 ステムプロットの描画
ax.stem(x, y, basefmt='green')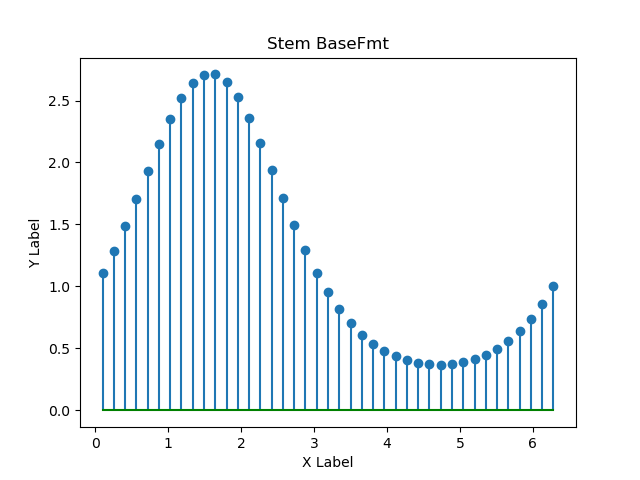
フォーマット文字列を使って,幹のベースラインの色とマーカーと線スタイルを同時に指定しますbasefmt='m-.D':m=マゼンタ,-.=一点鎖線,D=ダイヤ
# step3 ステムプロットの描画
ax.stem(x, y, basefmt='m-.D')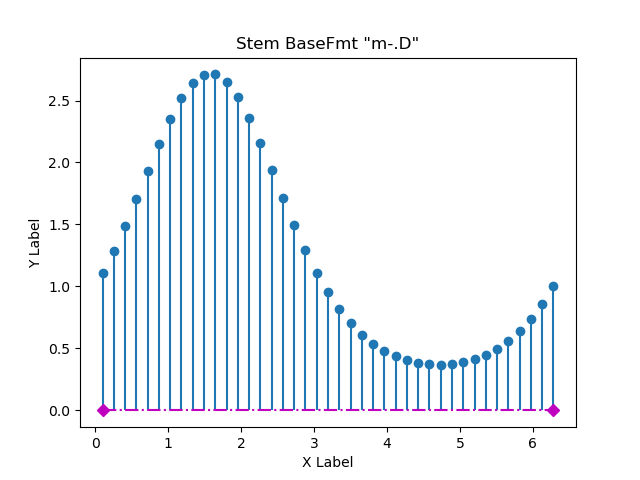
凡例ラベルとベースライン (label, bottom, orientation)
label: 凡例での文字列ラベルを指定します
bottomとorientationの例とともにラベルを指定し,凡例を表示しました
ベースラインの位置 (bottom)
ベースラインの位置を数値で指定できますbottom=1: y=1の位置
# step3 ステムプロットの描画
ax.stem(x, y, bottom=1, label='bottom=1')

# step4 軸ラベルとタイトルの設定
ax.legend()
ベースラインの方向 (orientation)
ステムプロットは幹が生える位置をx軸ではなく,y軸に変更することも可能です
ステムプロットの幹の方向
- 垂直:
orientation='vertical',デフォルト値 - 水平:
orientation='horizontal'
# step3 ステムプロットの描画
ax.stem(x, y, orientation='horizontal', label='hrizontal')

# step4 軸ラベルとタイトルの設定
ax.legend()
参考文献
ステムプロットの公式ドキュメント
Axes.stemの公式ドキュメント