\ 迷ったらまずTechAcademyの無料カウンセリング! /
【Matplotlib】拡大図と全体図を同時に表示する方法 (inset_axes, indicate_inset_zoom)

グラフを表示する際に,全体図はもちろん必要ですが,スケールの問題で拡大図が欲しい場合があります
軸スケールを変更することで拡大図は作成できますが,別々のファイルになって,あまりスマートではありません
そこでpythonのMatplotlibでグラフの拡大図と全体図を同じFig内に表示する方法を簡単に解説します
拡大図の配置場所を上部もしくは右部にカスタマイズする方法も説明します
グラフ内に拡大図を表示する (inset_axes, indicate_inset_zoom)
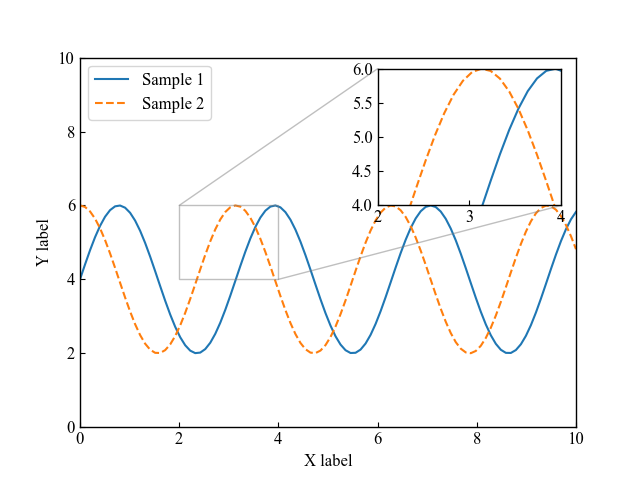
Matplotlibで作成したグラフ内に,拡大図を描画します
Axes.inset_axesとAxes.indicate_inset_zoomの2つを使います
下記のタブにコードとフローチャートで解説しています
import matplotlib.pyplot as plt
import numpy as np

# step1 データの作成
x = np.linspace(0, 10, 100)
y1 = 4 + 2 * np.sin(2 * x)
y2 = 4 + 2 * np.cos(2 * x)
# step2 グラフフレームの作成
fig, ax = plt.subplots(figsize=[6.4, 4.8])
# step3 折れ線グラフの描画
ax.plot(x, y1, linestyle='-', label='Sample 1')
ax.plot(x, y2, linestyle='--', label='Sample 2')

ax.set_xlim(0, 10)
ax.set_ylim(0, 10)
ax.set_xlabel('X label')
ax.set_ylabel('Y label')
ax.legend(loc='upper left')

# step4 zoomしたグラフの描画
axins = ax.inset_axes([0.6, 0.6, 0.37, 0.37])
axins.plot(x, y1, linestyle='-', label='Sample 1')
axins.plot(x, y2, linestyle='--', label='Sample 2')
# zoomしたグラフの設定
x1, x2, y1, y2 = 2, 4, 4, 6
axins.set_xlim(x1, x2)
axins.set_ylim(y1, y2)
ax.indicate_inset_zoom(axins)

plt.show()
Axes.inset_axes関数の使い方
拡大図の座標を決定しつつ,拡大図のオブジェクトを生成します
引数にはリストで,[x0, y0, 幅, 高さ]を0~1の間の数値で入力してください
あとは生成したaxinsインスタンスに,全体図と同様のプロットをすれば大丈夫です
- 引数
-
- bounds (x0, y0, width, height) : 挿入軸の左下隅,およびその幅と高さを数値で指定します
- projection (文字列) : Axesの投影方法を指定された文字列で変更することが可能です.指定できる文字列の種類はprojectionsを参考にしてください
- polar (bool) : Trueにすると,極座標になります
- zorder (float) : デフォルトは5です.高さまたは低さを調節し,全体図(親グラフ)の上または下にあるかどうかを変更できます.
- **kwargs : 他にも様々なカスタマイズができるので,公式ドキュメントを参考にしてみてください
- 返値
-
- ax : Axesオブジェクトが作成されます
- 公式ドキュメント
Axes.indicate_inset_zoom関数の使い方
全体図から拡大図への引き出し線と拡大エリアの長方形を表示します
全体図.indicate_inset_zoom(拡大図)とすれば,表示されます
- 引数
-
- inset_ax (Axes) : 引き出し線を引くための軸です.拡大エリアと拡大図を結ぶ2本の線が自動でひかれます
- facecolor (color) : グラフ拡大図の拡大エリアの色を指定できます
- edgecolor (color) :グラフ拡大図の引き出し線の色を指定できます
- alpha (float) : 透明度を数値で指定できます
- zorder (float) : デフォルトは4.99です.Axes.inset_axesのすぐ下に配置されます.
- **kwargs : このほかの引数については,Axes.indicate_insetを参考にしてください
- 返値
-
- rectangle_patch (patches.Rectangle) : 拡大図の要素です
- connector_lines (patches.ConnectionPatchの4要素の配列) : 左下,左上,右下,右上の4本の引き出し線です.2つは可視性がFalseに設定されています
- 公式ドキュメント
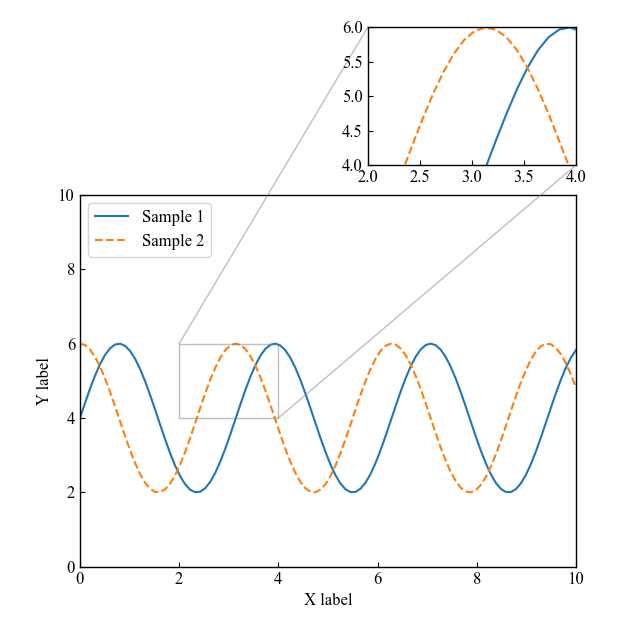
グラフ上部に拡大図を表示する (subplots_adjust)
全体図の上部に拡大図を被らせずに表示する方法です
plt.subplotsで作成したsubplotの位置とグラフサイズを調整することで,綺麗に表示されます
- 引数
-
- left (float) : subplotsの左端の位置を,figureの幅に対する割合で指定します
- right (float) : subplotsの右端の位置を,figureの幅に対する割合で指定します
- bottom (float) : subplotsの下端の位置を,figureの幅に対する割合で指定します
- top (float) : subplotsの上端の位置を,figureの幅に対する割合で指定します
- wspace (float) : subplot間の隙間の幅を,平均的なAxesの幅に対する割合で指定します
- hspace (float) : subplot間の隙間の高さを,平均的なAxesの幅に対する割合で指定します
- 公式ドキュメント
下記のタブにコードとフローチャートで解説しています
# step2 グラフフレームの作成
fig, ax = plt.subplots(figsize=[6.4, 6.4])
# step3 折れ線グラフの描画
ax.plot(x, y1, linestyle='-', label='Sample 1')
ax.plot(x, y2, linestyle='--', label='Sample 2')

# step4 zoomしたグラフの描画
axins = ax.inset_axes([0.58, 1.08, 0.42, 0.37])
axins.plot(x, y1, linestyle='-', label='Sample 1')
axins.plot(x, y2, linestyle='--', label='Sample 2')

# step4 zoomしたグラフの設定
x1, x2, y1, y2 = 2, 4, 4, 6
axins.set_xlim(x1, x2)
axins.set_ylim(y1, y2)
ax.indicate_inset_zoom(axins)

# アスペクト比の調整
ax.set_box_aspect(0.75)
# subplotの位置調整
fig.subplots_adjust(bottom=0.11, top=0.7)

plt.show()
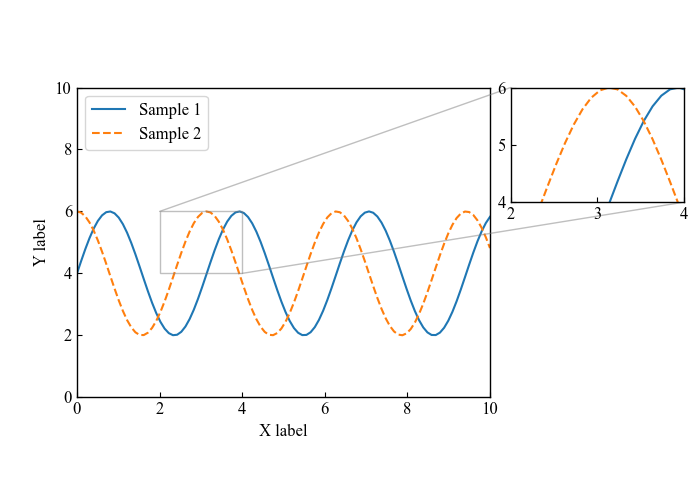
グラフ右部に拡大図を表示する
全体図の右部に拡大図を被らせずに表示する方法です
plt.subplotsで作成したsubplotの位置とグラフサイズを調整することで,綺麗に表示されます
下記のタブにコードとフローチャートで解説しています
# step2 グラフフレームの作成
fig, ax = plt.subplots(figsize=[7, 4.8])
# step3 折れ線グラフの描画
ax.plot(x, y1, linestyle='-', label='Sample 1')
ax.plot(x, y2, linestyle='--', label='Sample 2')

# step4 zoomしたグラフの描画
axins = ax.inset_axes([1.05, 0.63, 0.42, 0.37])
axins.plot(x, y1, linestyle='-', label='Sample 1')
axins.plot(x, y2, linestyle='--', label='Sample 2')

# step4 zoomしたグラフの設定
x1, x2, y1, y2 = 2, 4, 4, 6
axins.set_xlim(x1, x2)
axins.set_ylim(y1, y2)
ax.indicate_inset_zoom(axins)
# アスペクト比の調整
ax.set_box_aspect(0.75)
# subplotの位置調整
fig.subplots_adjust(left=0.11, right=0.7)

plt.show()
参考文献
Matplotlibでのグラフ拡大図
Axes.inset_axes関数の公式ドキュメント
Axes.indicate_inset_zoom関数の公式ドキュメント
お疲れ様でした

コメント